AI model
Overview
Section titled “Overview”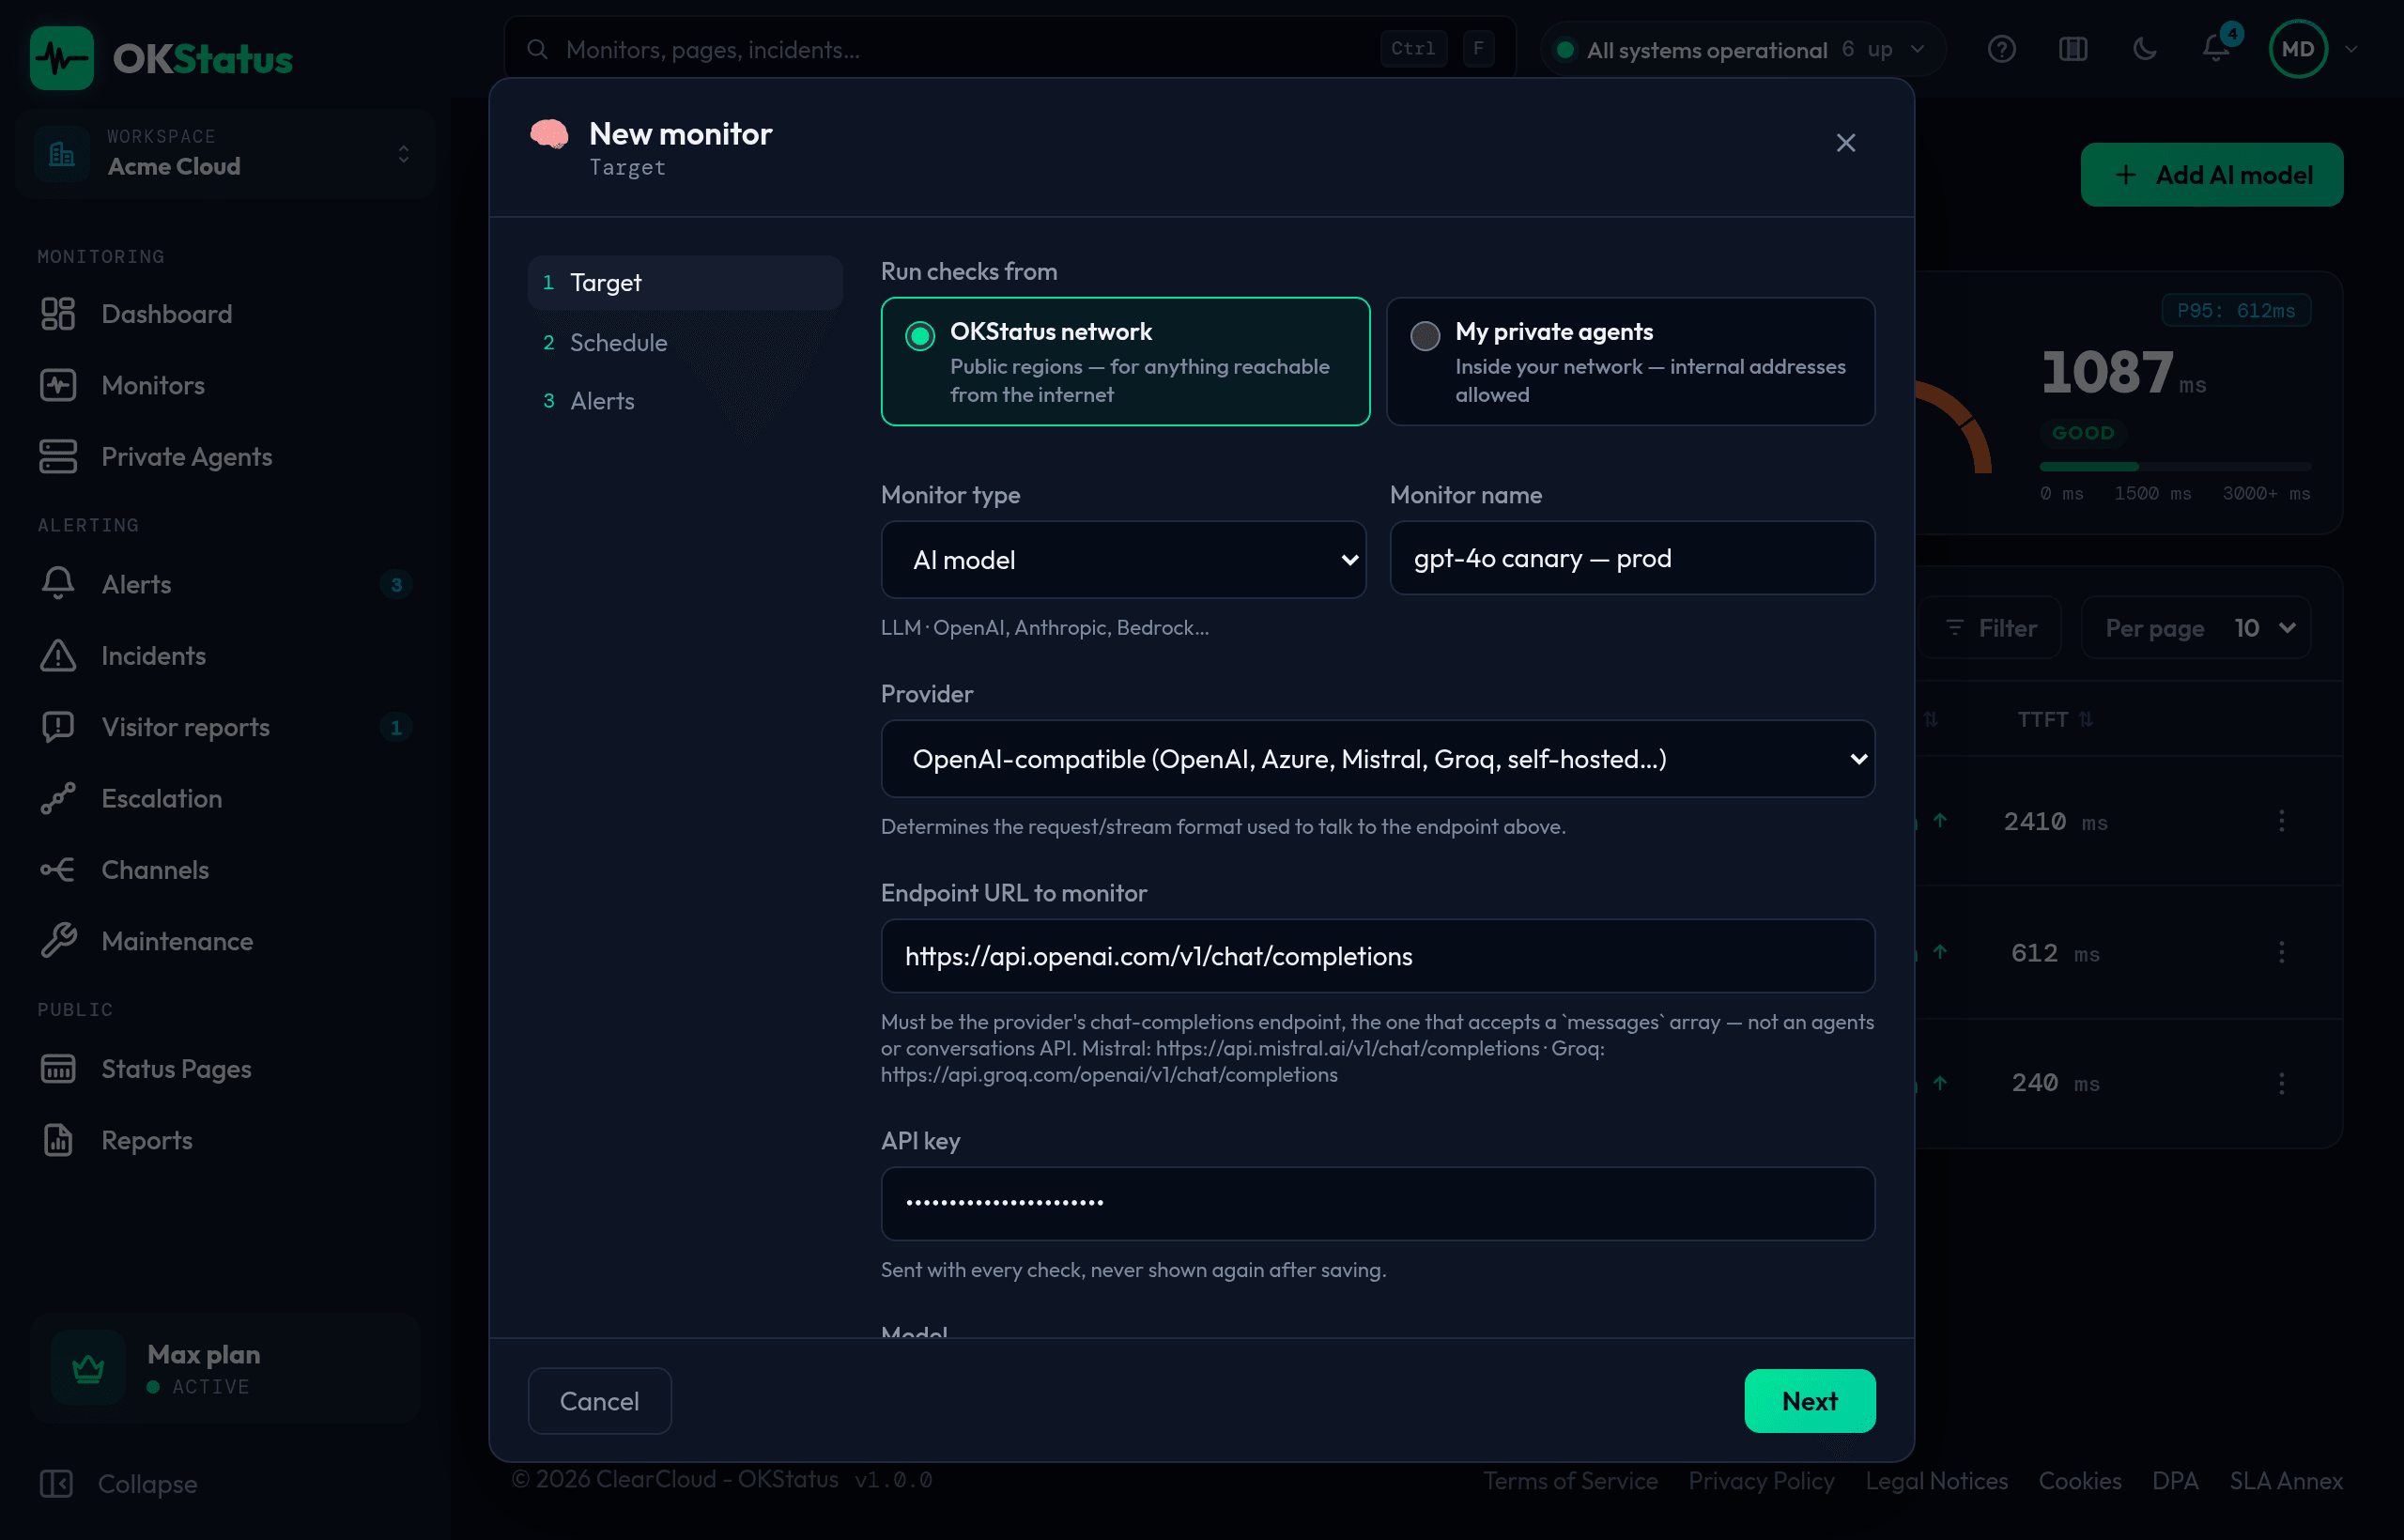
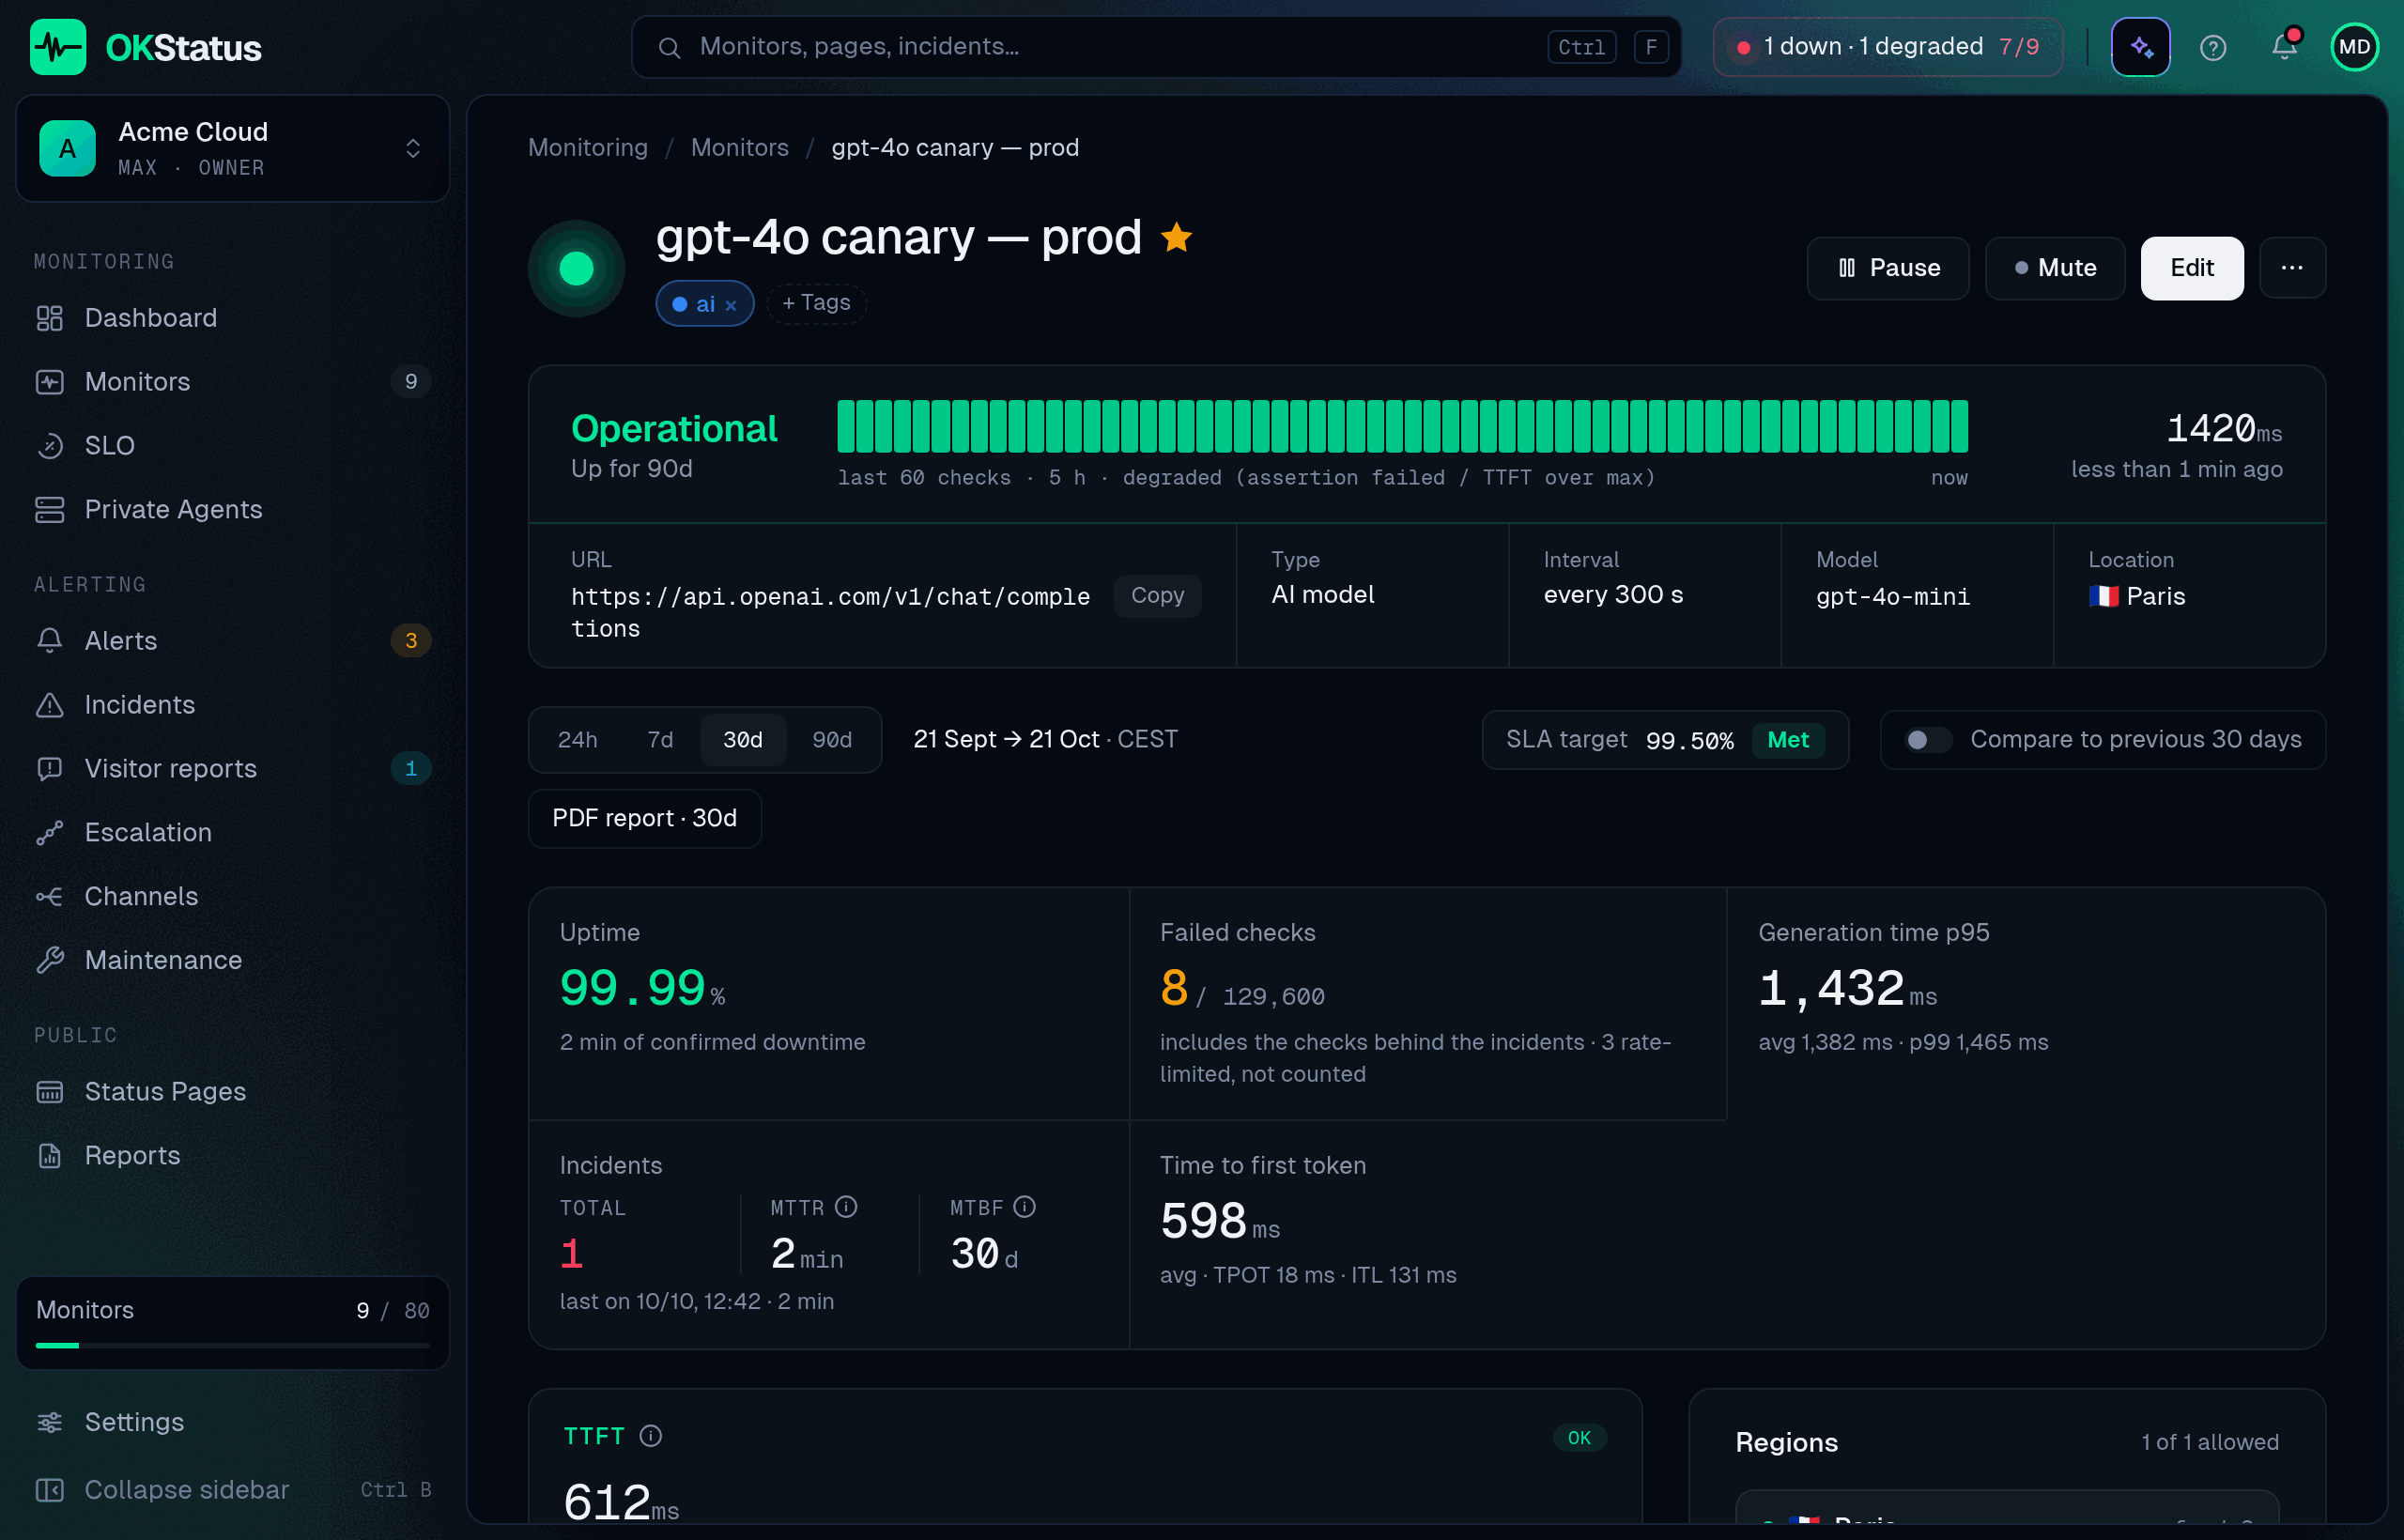
The AI model monitor (an LLM canary) sends a fixed prompt to an LLM provider’s chat-completions endpoint on a schedule and checks that it responds — and responds correctly — within acceptable time. It’s built for teams running production features on top of an LLM API who need to know the moment that dependency degrades, not just when it’s fully down.
Create one from Monitors → Add monitor and pick AI model in the monitor type list: the dialog then asks for the provider, endpoint, API key and model instead of the HTTP options. In the Monitors list, AI models show their provider’s logo in the Type column and their time to first token in the Avg /24h column; pick AI model in the Monitor type filter to see only them, with a Provider · Model column and the average TTFT.
Available on Max (up to 5 AI models) and Enterprise (up to 20). An AI model monitor runs from a single region — the point is the provider’s health, not geographic reachability, and every check costs you real tokens.
Self-hosted models (private agents)
Section titled “Self-hosted models (private agents)”A model served inside your own network (Ollama, vLLM, TGI…) is reachable only
from there. With private agents, choose My private
agents under Run checks from, then the agent that can reach it: internal
addresses such as http://ollama.internal:11434/v1/chat/completions are
allowed. The check runs from that one agent, the same way a region is used for
a public provider.
Settings
Section titled “Settings”| Setting | Description | Default |
|---|---|---|
| Provider | OpenAI-compatible (OpenAI, Azure, Mistral, Groq, self-hosted…), Anthropic, or AWS Bedrock | OpenAI-compatible |
| Endpoint URL to monitor | The provider’s chat-completions endpoint — the one that accepts a messages array, not an agents or conversations API | — |
| API key | Sent with every check, never shown again after saving. For Bedrock: access_key_id:secret_access_key, plus the AWS region | — |
| Model | The model identifier to call | — |
| Canary prompt | The fixed prompt sent on every check | — |
| Region | Where the check runs from — one region, or one private agent | — |
| Max time to first token | Above this, in ms, the check is reported as degraded rather than down | 1500 ms |
| Expected response | Optional — the check is degraded if the response doesn’t match exactly (after trimming) | — |
Provider, endpoint, key and model are on the Target step; the prompt, the
TTFT limit and the expected response are on the Schedule step, next to the
interval. Pick a prompt with one short, deterministic answer (Reply with the single word OK) if you set an expected response: the comparison is exact, not a
“contains”.
Result states
Section titled “Result states”Unlike other monitor types, which only ever report up or down, AI model checks distinguish four states:
- Up — Responded in time, with the expected response when you set one.
- Degraded — Responded, but failed the quality assertion or exceeded the max TTFT (the provider is up, but not performing to spec).
- Ratelimit — Got an isolated 429 from the provider — treated separately from a real outage so a burst of rate-limiting doesn’t page you as if the provider were down.
- Down — No usable response at all (timeout, connection error, 5xx).
Use cases
Section titled “Use cases”- Catch silent quality regressions — A provider-side model update or an upstream config change can leave the endpoint technically “up” while responses degrade; the content assertion catches that.
- Track latency drift — TTFT is often the first signal of provider-side capacity issues, well before outright failures.
- Distinguish rate-limiting from outages — Avoid false alarms when you’re simply hitting your own quota.
Metrics collected
Section titled “Metrics collected”Every check records the result state, the generation time, the time to first token (TTFT), the time per output token (TPOT), the inter-token latency (ITL) and whether the content assertion passed — feeding the same charts and PDF reports as every other monitor type. Each metric is defined in Metrics & KPIs.