
Introduction
What is OKStatus?
Section titled “What is OKStatus?”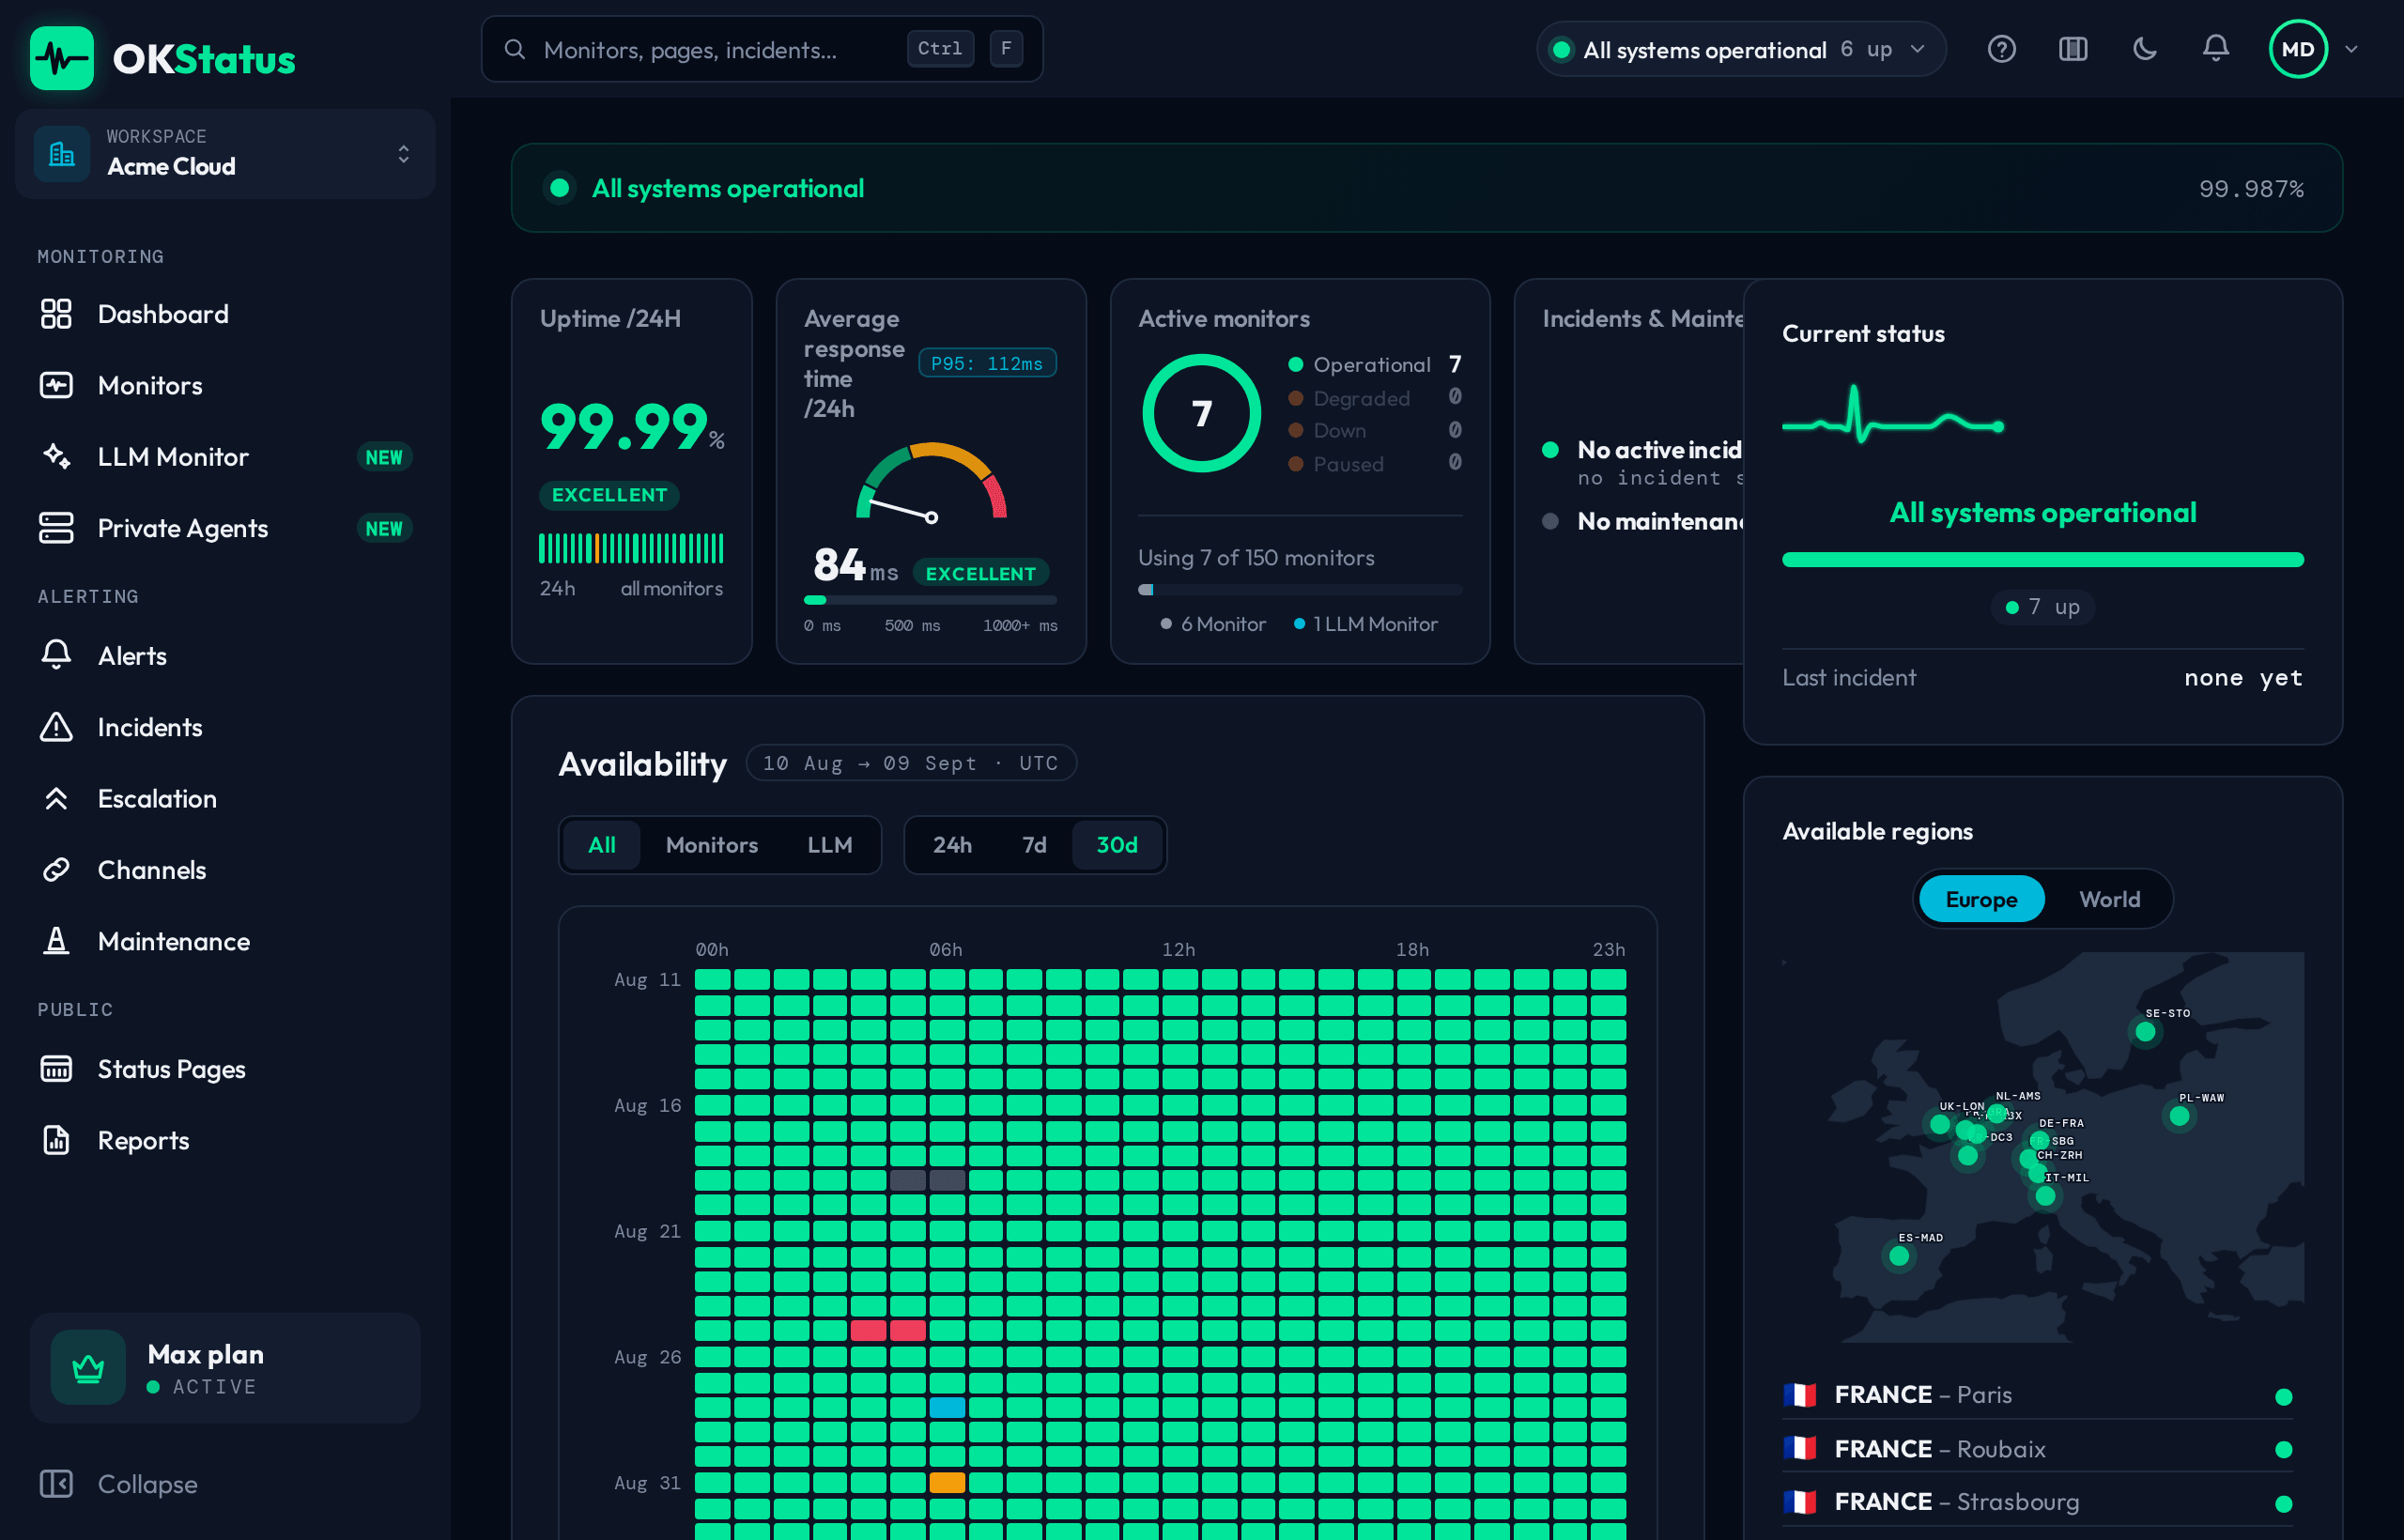
OKStatus is an uptime monitoring platform designed and hosted 100% in Europe. It watches the availability of your websites, APIs, and servers from multiple geographic regions and alerts you in real time when something goes down.
OKStatus is GDPR-native: your account, your monitors and their history are stored in the European Union, with no Google Analytics and no third-party cookies.
Why OKStatus?
Section titled “Why OKStatus?”100% European hosting
Section titled “100% European hosting”The platform and its database run on Scaleway in Paris; backups are stored on OVHcloud in Gravelines. Your monitoring data, incidents, and status pages stay in the EU — no exceptions. The probes that run your checks, and the address each one checks from, are listed in Probe IP addresses.
GDPR without compromise
Section titled “GDPR without compromise”- No Google Analytics — anonymized, cookieless stats via Matomo, self-hosted by ClearCloud in France
- Built-in data export (JSON/CSV) and right to erasure
- Data Processing Agreement (DPA) on every plan, signed copy on request
- Transparent privacy policy
How it compares
Section titled “How it compares”| OKStatus | UptimeRobot | Better Stack | Instatus | |
|---|---|---|---|---|
| Free plan | Yes | Yes | Yes | Yes |
| Data hosted in the EU by default | Yes | No | Yes | No |
| PDF SLA reports | Yes | Email reports | CSV (paid add-on) | No |
| Discord alerts on the free plan | Yes | No | No | No |
| Status pages | Yes | Yes | Yes | Yes |
| Official MCP server | Yes | Yes | Yes | No |
Checked against each vendor’s public pages on 2026-10-05 — the same table as on the pricing page, which is kept current.
Key features
Section titled “Key features”- HTTP/HTTPS, Ping, TCP, DNS, gRPC, database (PostgreSQL, MySQL/MariaDB, MongoDB), mail and cache (SMTP, IMAP, Redis) and AI model (LLM) monitors — Intervals from 30 seconds to 5 minutes, from 3 to 24 regions.
- Public status pages — Your own URL (
okstatus.eu/your-slug/status/your-page), two layouts, logo and accent colour, e-mail subscriptions, an RSS feed, password protection and an embeddable widget. - Multi-channel alerts — Eighteen channels: Discord, Telegram, webhooks, email, Slack, PagerDuty, Grafana IRM, Jira and more. Anti-false-positive logic (retry window + majority rule across regions).
- Escalation policies — Levels, delays and repeats until someone acknowledges.
- Incident management — Manual or alert-driven creation, real-time updates, scheduled maintenance windows.
- Instant and scheduled PDF reports — Uptime %, response time, charts — generated on demand or emailed automatically on a recurring schedule.
- Private agents — Run a checker inside your own network to monitor what the public internet can’t reach.
- REST API, Terraform provider and MCP connector — Automate everything through secured endpoints, or ask an AI assistant about your monitors.
- Team, SSO and audit — Roles (owner, admin, member, viewer), two-factor authentication, SAML/OIDC single sign-on and an audit log.
Pricing plans
Section titled “Pricing plans”| Plan | Price | Monitors | Interval | Regions |
|---|---|---|---|---|
| Free | €0 | 5 | 5 min | 3 (Paris, Frankfurt, Madrid) |
| Pro | €9/mo | 20 | 1 min | 6 (+ London, Amsterdam, Warsaw) |
| Max | €39/mo | 80 | 30 sec | 12 (worldwide) |
| Enterprise | from €99/mo | 500 included, more on request | 30 sec | 24 (worldwide) |
Annual billing: Pro −10 %, Max and Enterprise −20 %. Free and Pro are self-serve; Max and Enterprise are set up with our sales team. Private agents are included on Max (5) and Enterprise (20). The pricing page is the reference for the full feature grid.
Who is it for?
Section titled “Who is it for?”OKStatus is built for developers, DevOps/SRE teams, web agencies, and SaaS vendors who want reliable monitoring without compromising on data sovereignty.
Ready to get started? Follow the Quick Start guide to create your first monitor in under 5 minutes.