
Quick Start
This guide walks you from signing up to a working first monitor. Goal: under 5 minutes.
Step 1 — Create an account
Section titled “Step 1 — Create an account”- Go to okstatus.eu and click Get started free.
- Sign in with Google, GitHub or GitLab, or create an account with an email and password. Enterprise customers can sign in through their own identity provider with Sign in with SSO and their organisation slug.
- Accept the Terms of Service.
Authentication is handled by Keycloak, hosted in France. No password ever reaches OKStatus itself when you sign in with a provider or SSO.
Step 2 — Create your organization
Section titled “Step 2 — Create your organization”The onboarding wizard runs in five short steps — workspace, first monitor, alerts, status page, done — each with a one-line explanation you can switch off (“Expert mode”). The first one asks for:
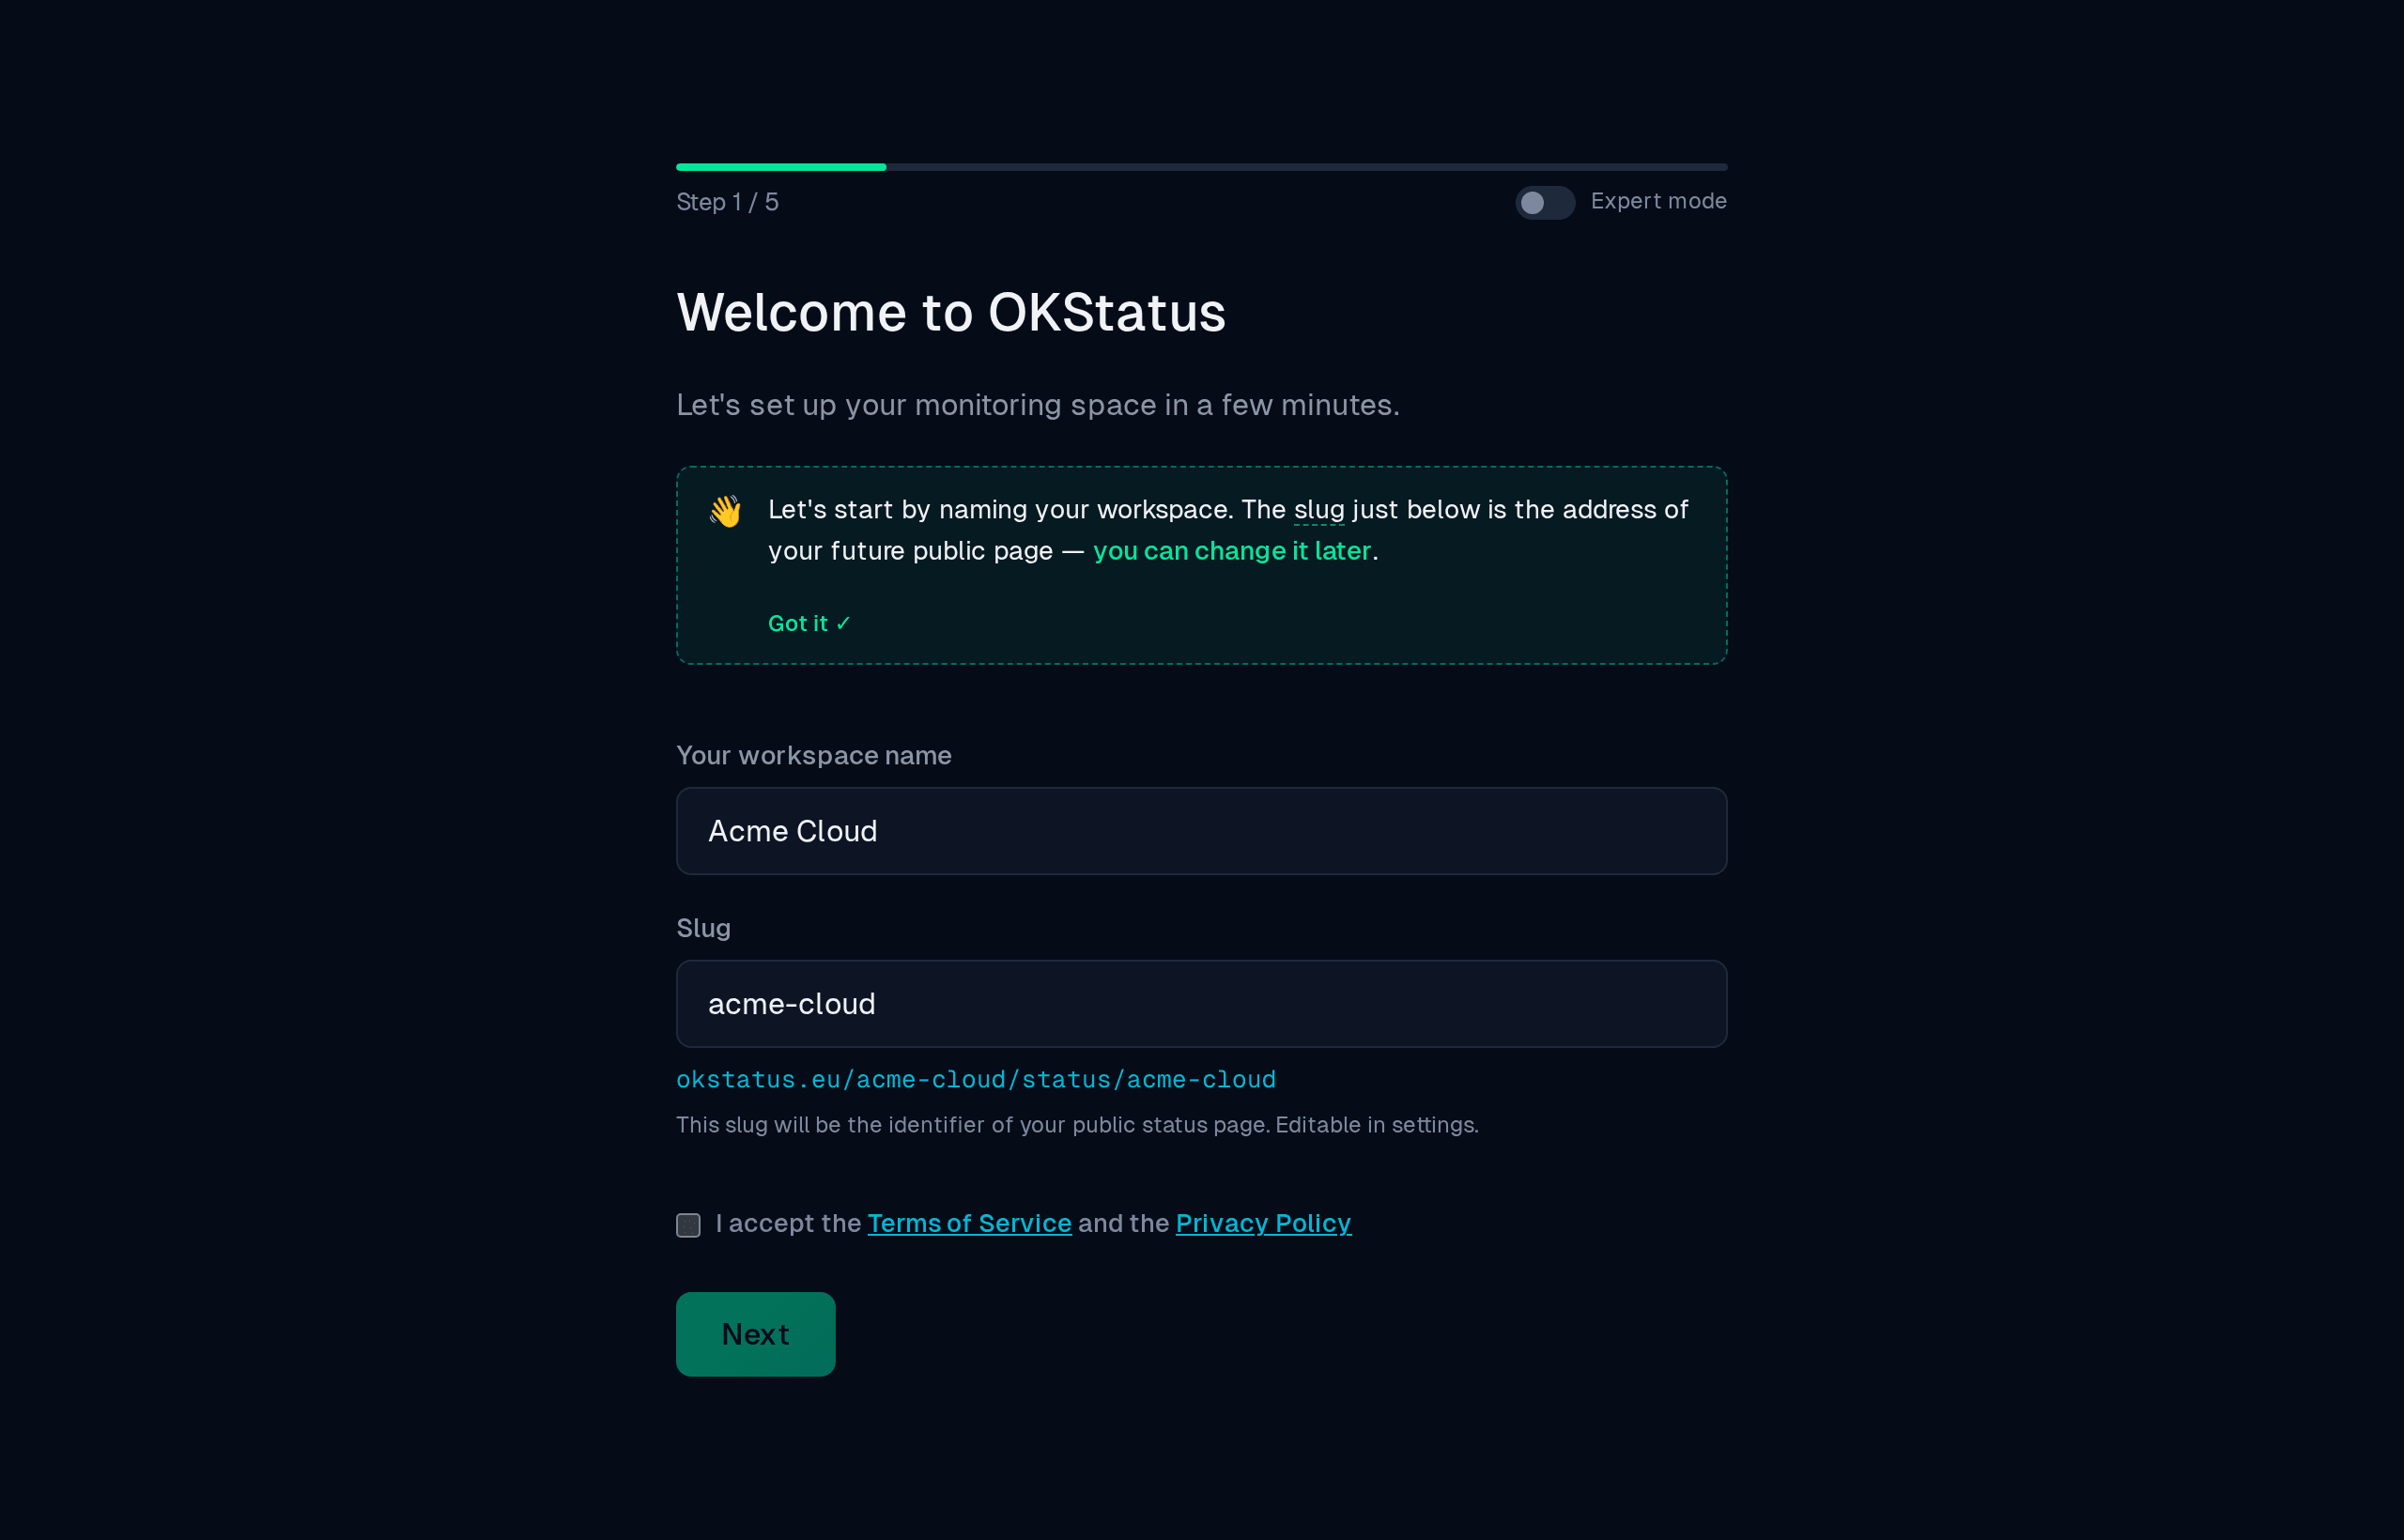
- Workspace name — Shown in the dashboard (e.g. “Acme Corp”).
- Slug — The prefix of every status page URL you will publish
(
okstatus.eu/acme-corp/status/…). Editable later in Settings → General, but changing it breaks existing links.
Your time zone and date format are set afterwards, in Settings.
Step 3 — Add your first monitor
Section titled “Step 3 — Add your first monitor”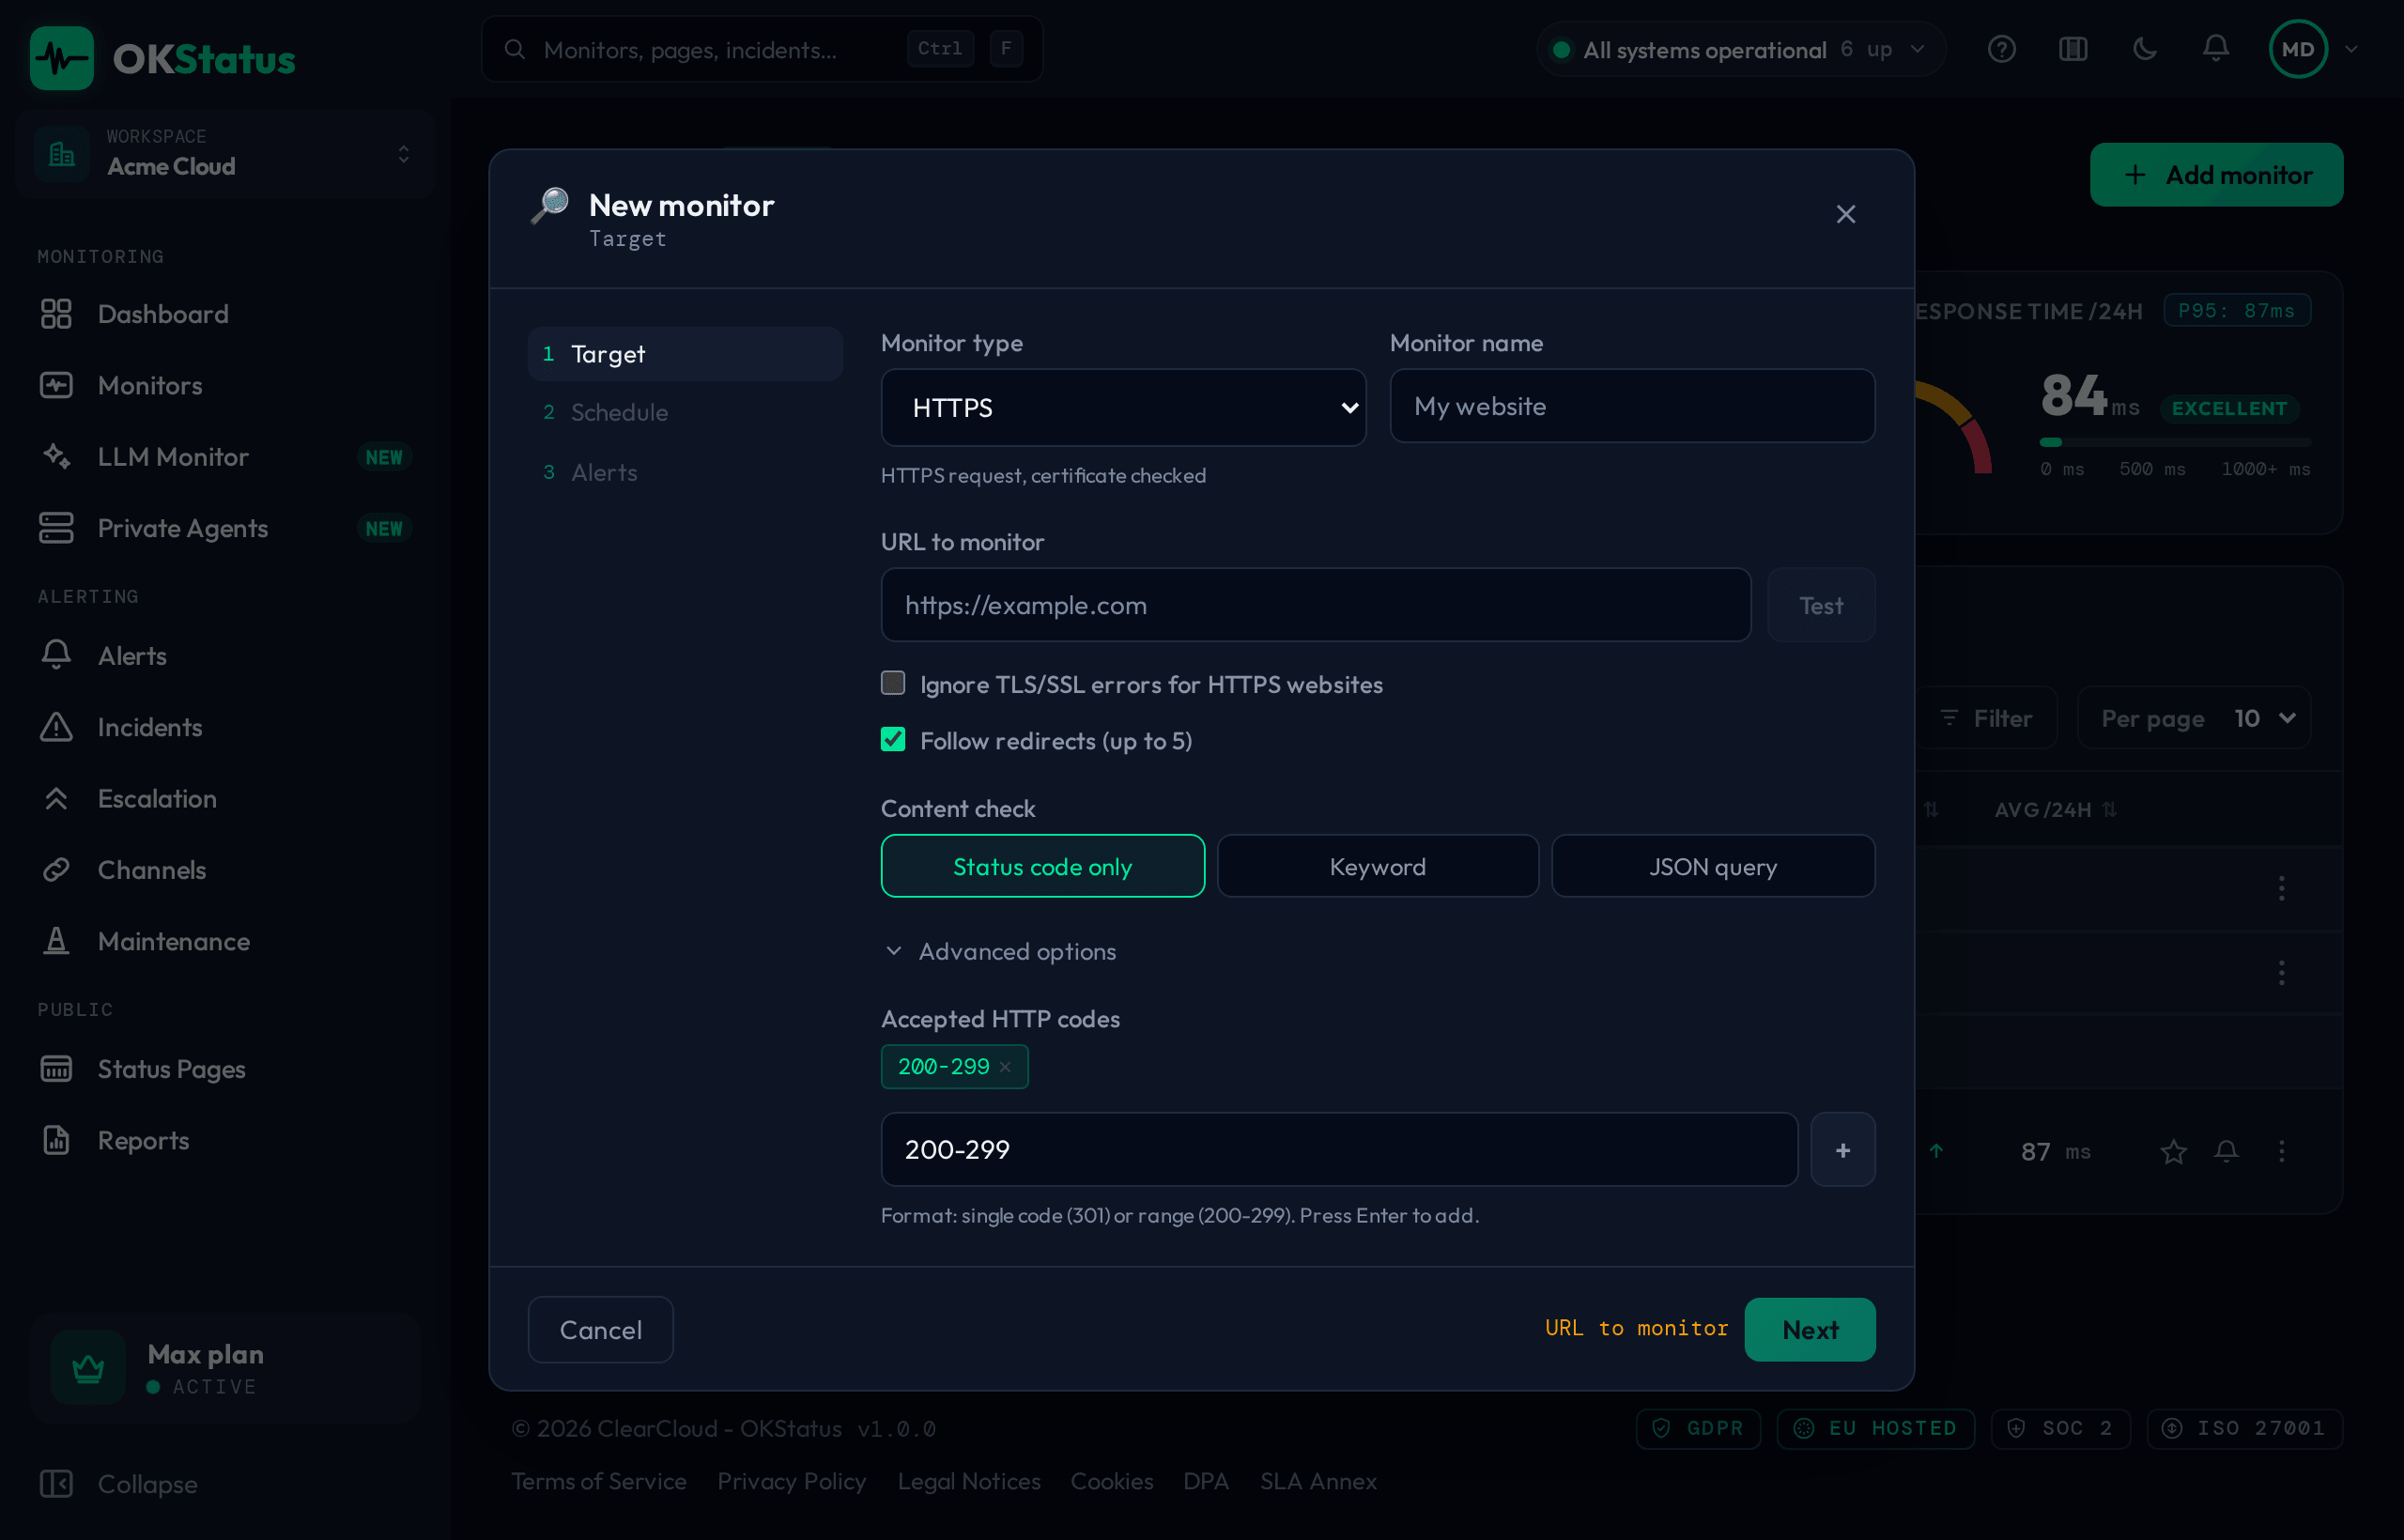
-
From the dashboard or the Monitors page, click Add monitor. The New monitor dialog opens on its first step, Target.
-
Choose the type:
- HTTPS / HTTP — Monitor a website or API (most common).
- Ping — Check that a server responds at the network level.
- DNS — Verify a DNS record resolves to the expected value.
- TCP — Test connectivity to a specific port.
- gRPC — Health-check a gRPC service.
- PostgreSQL / MySQL / MongoDB — Connect and run a real query.
- SMTP / IMAP / Redis — Speak the protocol, and authenticate when you give the monitor credentials.
To monitor an LLM endpoint, pick AI model in the same list.
-
Enter the URL, host or connection string:
https://my-site.comTest runs the check immediately, so you can see the answer before saving.
-
Configure the options (the content check is on the first step, interval and regions on the Schedule step):
- Interval — Check frequency (5 min on Free, 1 min on Pro, 30 s on Max).
- Regions — Where to monitor from. Free picks one; Pro allows 3 and Max 5 per monitor.
- Content check (HTTP) — Verify the response contains a keyword, or that a JSON path holds an expected value.
-
Attach an alert channel on the last step, Alerts, then click Create monitor.
The first check starts immediately. Within seconds you’ll see your service’s status.
Step 4 — Configure an alert
Section titled “Step 4 — Configure an alert”A monitor without an alert isn’t very useful. Configure at least one channel:
- Go to Alerting → Channels.
- Click Add a channel.
- Choose the type. On the Free plan that means Discord, Telegram or a generic Webhook; Email, Slack and the rest start at Pro — the full grid is on Alert channels.
- Apply to all my monitors is ticked by default, so the channel starts attached to every monitor you have right now. Untick it to pick monitors yourself.
- Click Test to confirm the destination actually receives something.
Step 5 — Create your status page
Section titled “Step 5 — Create your status page”- Go to Status Pages in the sidebar and click Create a status page.
- Customize the title, description, and logo, and pick the monitors it shows.
- Leave Page published on.
- Share the URL —
okstatus.eu/your-org-slug/status/your-page-slug— with your users. The list has a Copy link action for it.
Visitors can subscribe by email, or follow the page’s RSS feed, to get notified of incidents.
What’s next?
Section titled “What’s next?”- First Monitor in detail — Advanced options (headers, assertions, SSL).
- Configuring alerts — Email, Discord, webhooks, step by step.
- Status Pages — Custom domain, branding.
- Scheduled Reports — Recurring PDF reports by email.