
First Monitor
Step 1: Open the dashboard
Section titled “Step 1: Open the dashboard”Log in to your OKStatus account. From the dashboard or the Monitors page, click the Add monitor button. The New monitor dialog has three steps: Target, Schedule and Alerts.
Step 2: Configure the HTTP monitor
Section titled “Step 2: Configure the HTTP monitor”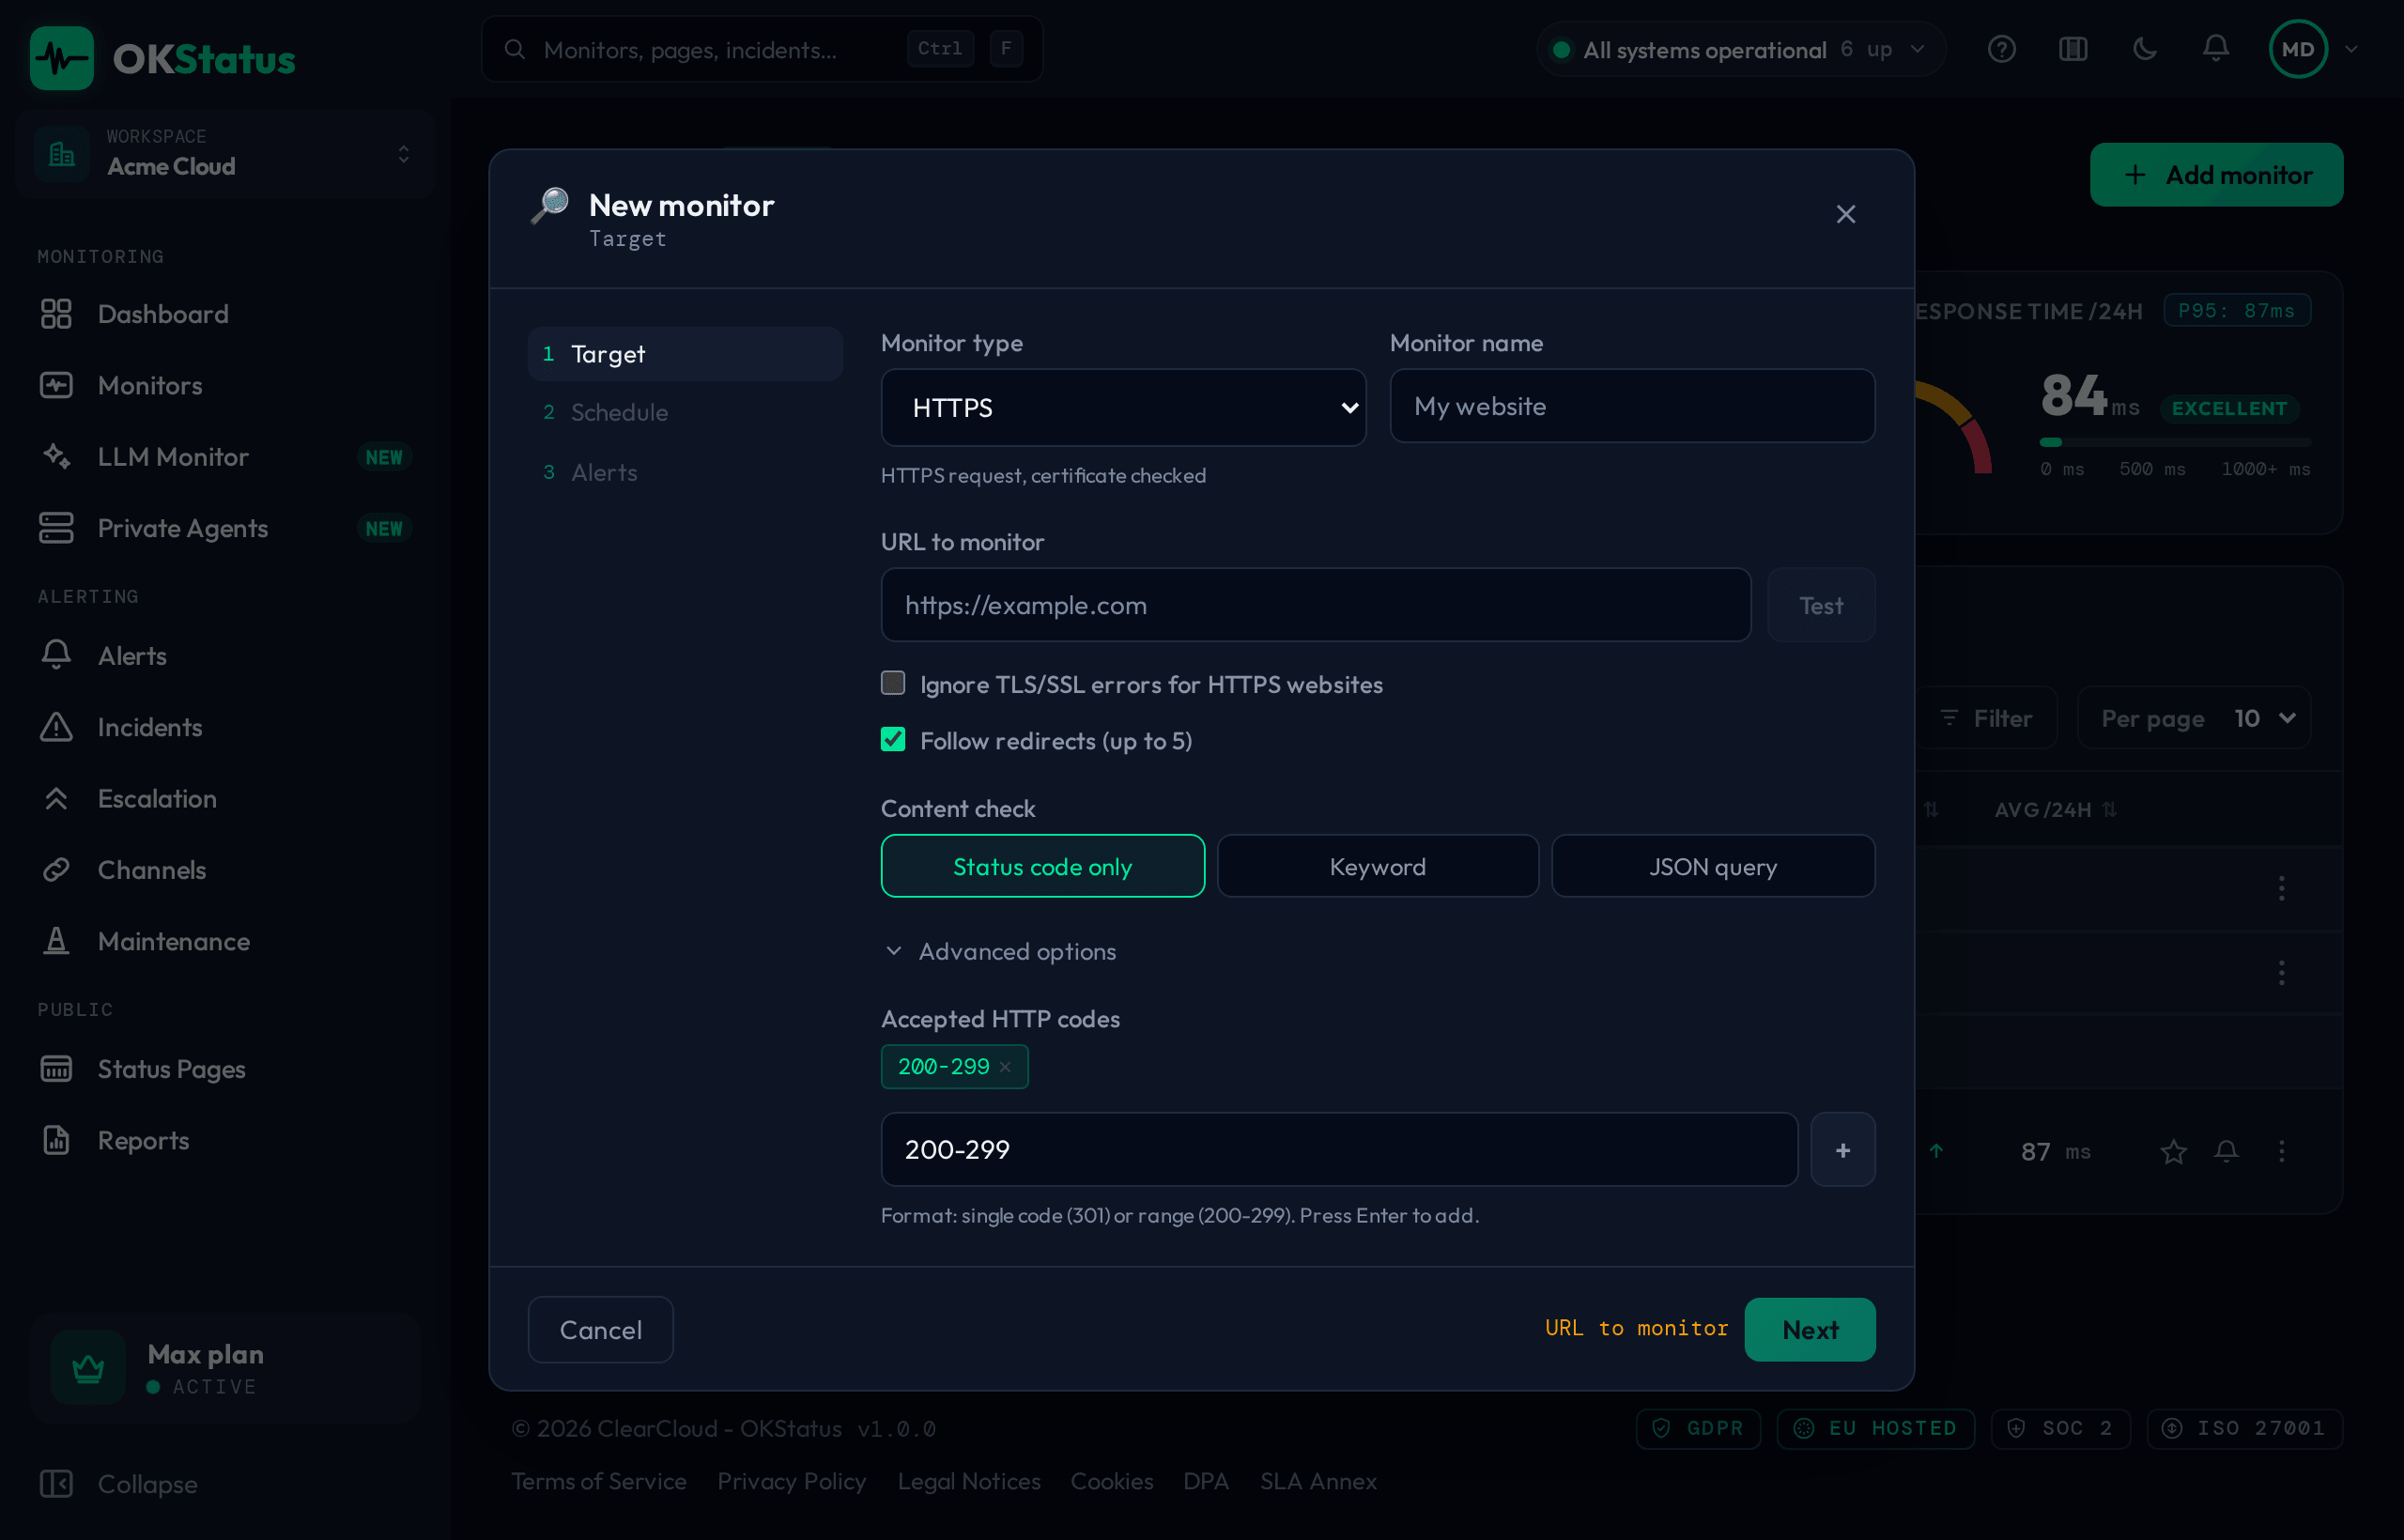
Fill in the following fields:
- Name — A descriptive name, e.g. “Main website”.
- URL — The full address to monitor, e.g.
https://example.com. - Method — GET (default) or POST if you need to send a body.
- Interval — Check frequency, from 30 seconds to 5 minutes depending on your plan (see the table below). It is set in the Schedule step.
- Expected code(s) — The HTTP status code(s) considered a success, e.g.
200or a range like200-299.
Step 3: Advanced options
Section titled “Step 3: Advanced options”You can also configure:
- Custom headers — Add HTTP headers (e.g.
Authorization). - Keyword check — Verify specific text is present in the response (and optionally invert the check to fail when the text is found).
- JSON query — Resolve a path in a JSON response (
component.status, or$for the raw body) and compare it to an expected value. Keyword and JSON query are the two modes of the Content check selector. - Tags — Free-form labels to organize and filter your monitor list.
- Regions — Select the geographic check locations, in the Schedule step next to the interval.
Regions and intervals per plan
Section titled “Regions and intervals per plan”Each region code maps to a real monitoring agent. Codes follow a cc-city
convention (country code + city). Which ones you can select, how many a single
monitor may use, and the shortest interval you’re allowed all depend on your
plan:
| Region code | Location | Minimum plan |
|---|---|---|
fr-dc3 | Paris | Free |
de-fra | Frankfurt | Free |
es-mad | Madrid | Free |
uk-lon | London | Pro |
nl-ams | Amsterdam | Pro |
pl-waw | Warsaw | Pro |
se-sto | Stockholm | Max |
dk-cph | Copenhagen | Max |
us-nyc | New York | Max |
us-sjo | San José | Max |
sg-sgp | Singapore | Max |
au-syd | Sydney | Max |
fr-sbg | Strasbourg | Enterprise |
ie-dub | Dublin | Enterprise |
it-mil | Milan | Enterprise |
ch-zrh | Zurich | Enterprise |
ca-bhs | Montreal | Enterprise |
br-sao | São Paulo | Enterprise |
cl-scl | Santiago | Enterprise |
in-mum | Mumbai | Enterprise |
za-jnb | Johannesburg | Enterprise |
bh-man | Manama | Enterprise |
qa-doh | Doha | Enterprise |
jp-tyo | Tokyo | Enterprise |
That is 3 regions on Free, 6 on Pro, 12 on Max, and all 24 on Enterprise. The Enterprise cities are put online on request.
If your service filters incoming traffic by IP, the addresses each region checks from are listed in Probe IP addresses.
| Plan | Minimum interval | Regions per monitor |
|---|---|---|
| Free | 300s (5 min) | 2 |
| Pro | 60s (1 min) | 3 |
| Max | 30s | 5 |
| Enterprise | 30s | 5 |
Max and Enterprise also include private agents (5 and
20), each one selectable as a private:<agentId> pseudo-region.
Selecting a region above your plan (from the dashboard, the REST API, or the Terraform provider) is rejected server-side, not silently downgraded.
Step 4: Enable alerts
Section titled “Step 4: Enable alerts”The Alerts step starts with Retries before down: how many failed checks in a row are tolerated before the monitor is down (None to 5, 1 by default — two failures in a row). Below it, Response time sets an optional threshold above which the monitor turns degraded and alerts — see Response time alerts.
Then attach one or more alert channels to this monitor. You’ll be notified as soon as an outage is confirmed. For each channel you can also choose which alert kinds it should receive: up/down, SSL certificate expiry, and domain expiry.
Click Create monitor to start monitoring immediately.
Step 5: Read the monitor’s page
Section titled “Step 5: Read the monitor’s page”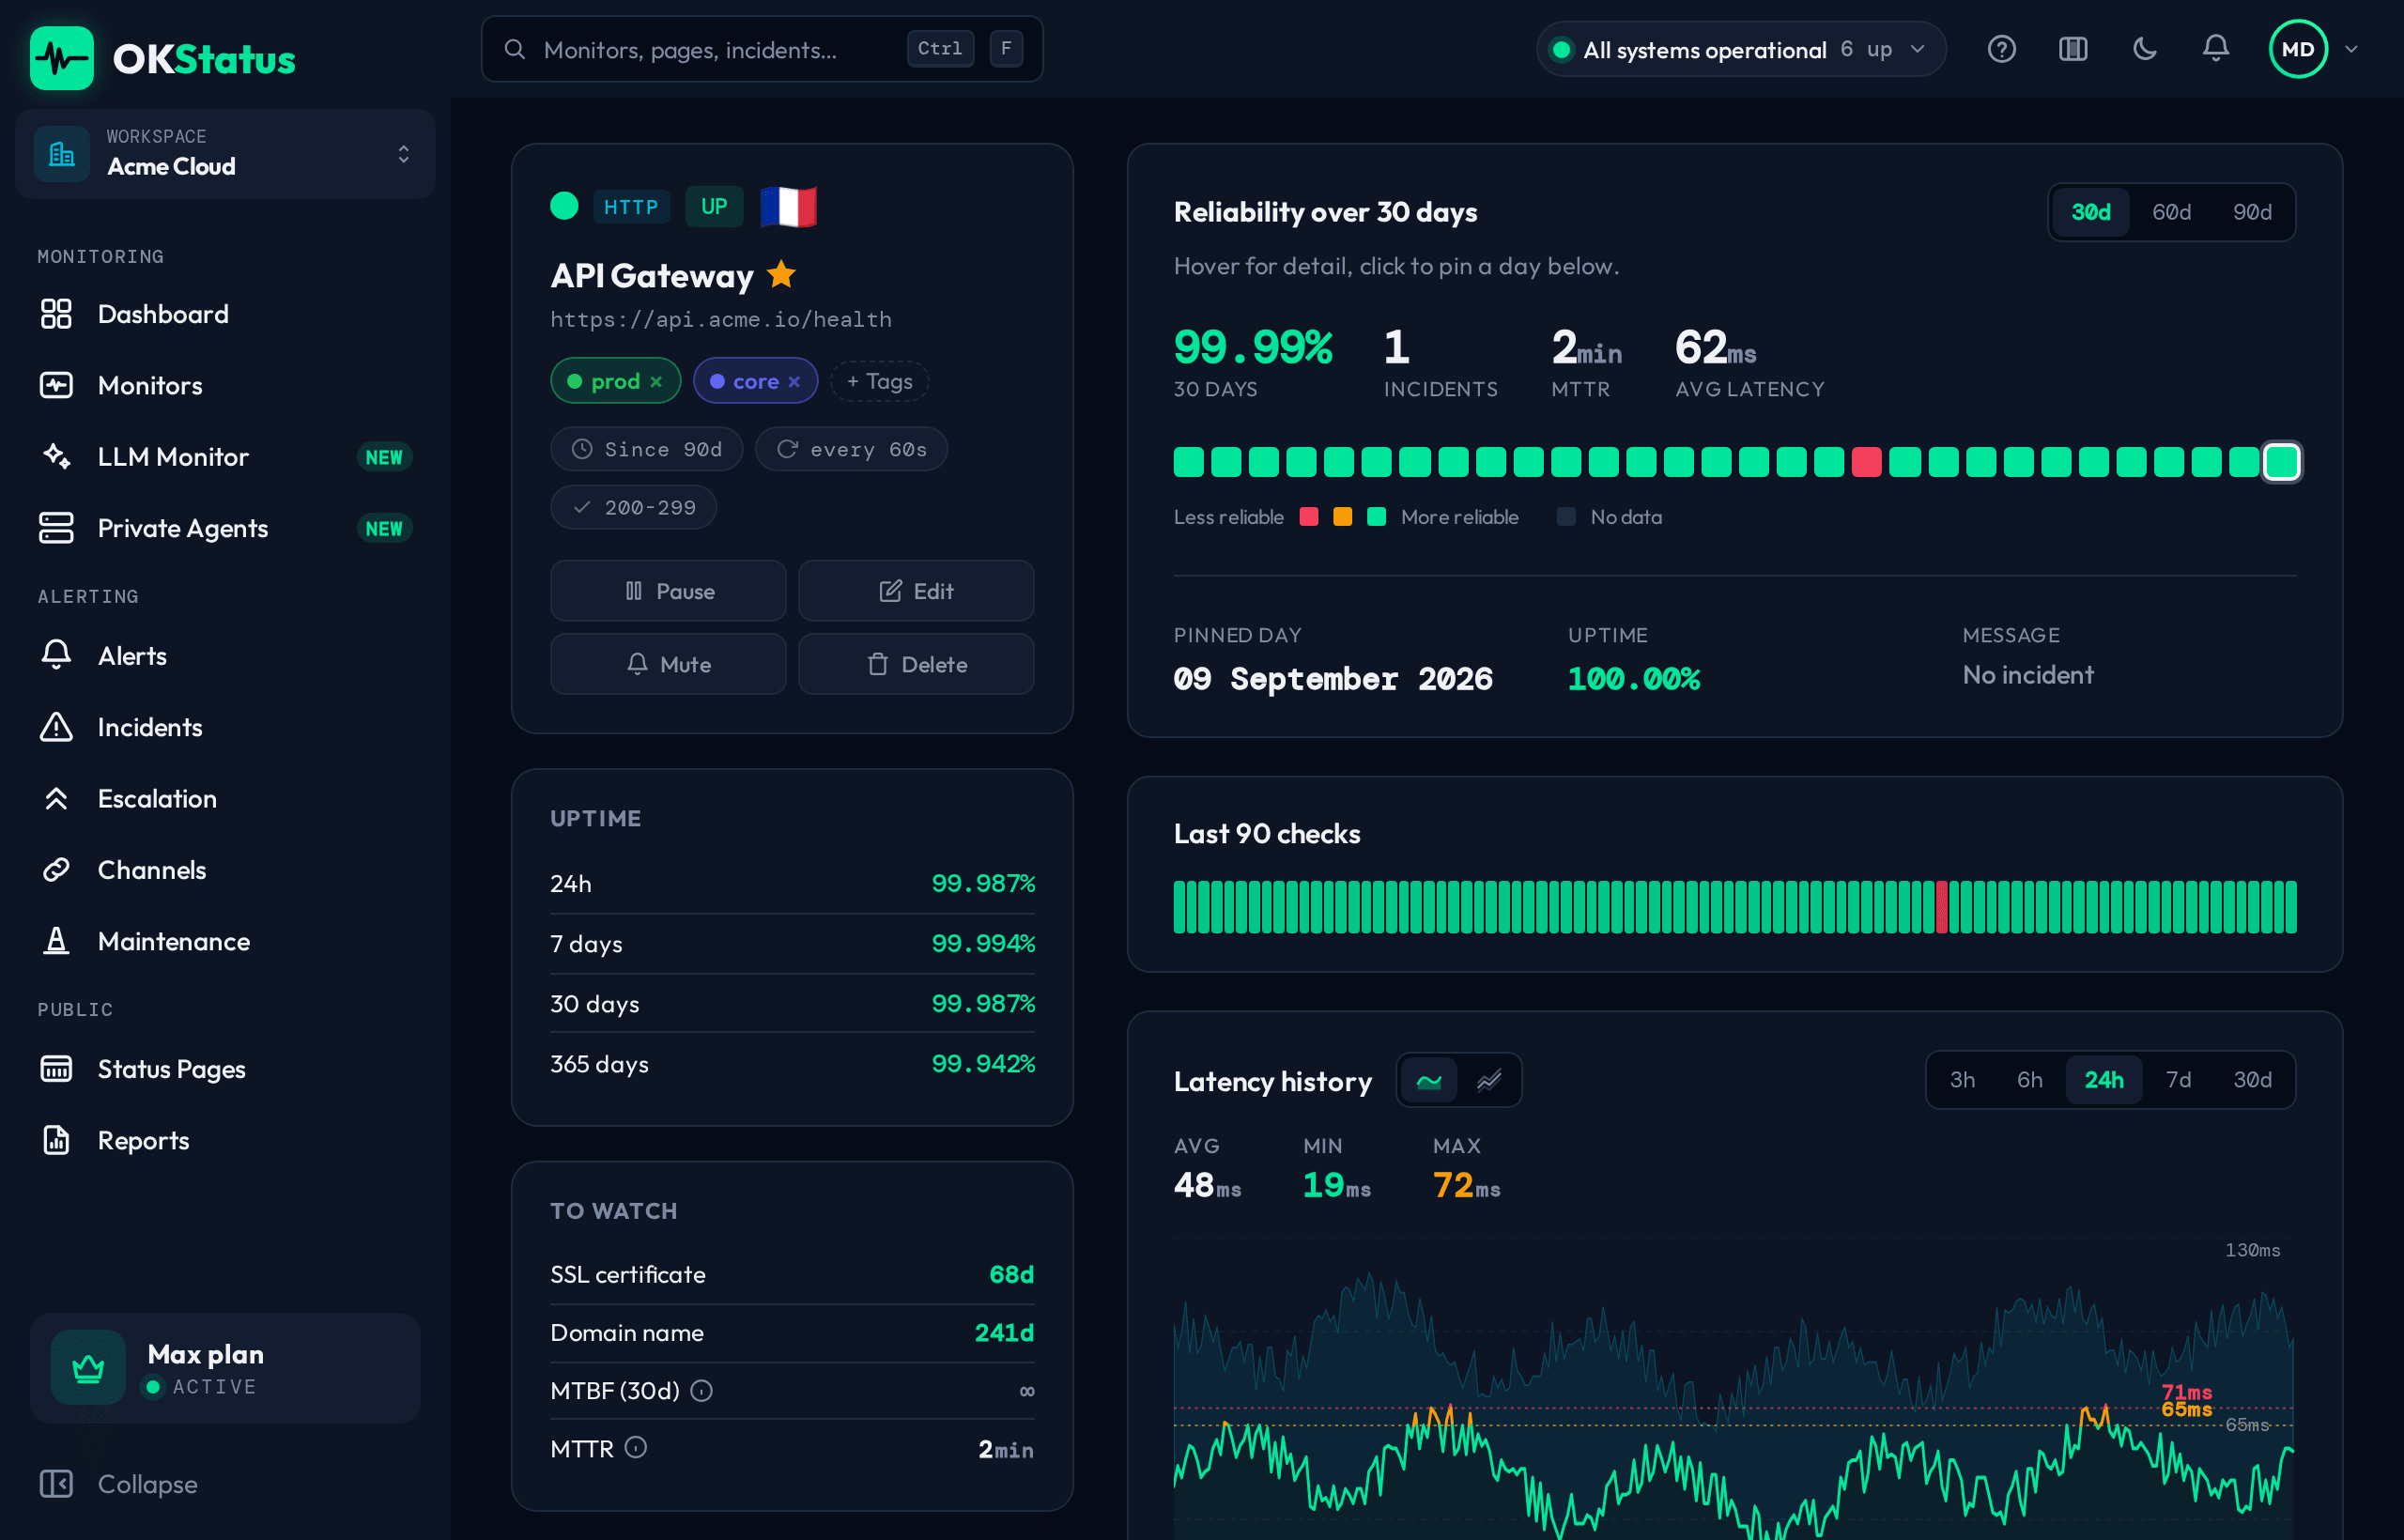
Open the monitor from the list. The header shows the current status and the last 60 checks; below it, pick a range — 24h, 7d, 30d or 90d — to read uptime, failed checks, response-time percentiles, incidents (with MTTR and MTBF) and, for HTTPS, the days left on the certificate and the domain. Compare to previous puts the same figures side by side with the period before, and PDF report exports the range. Edit reopens the same dialog you created the monitor with.