
HTTP/HTTPS
Overview
Section titled “Overview”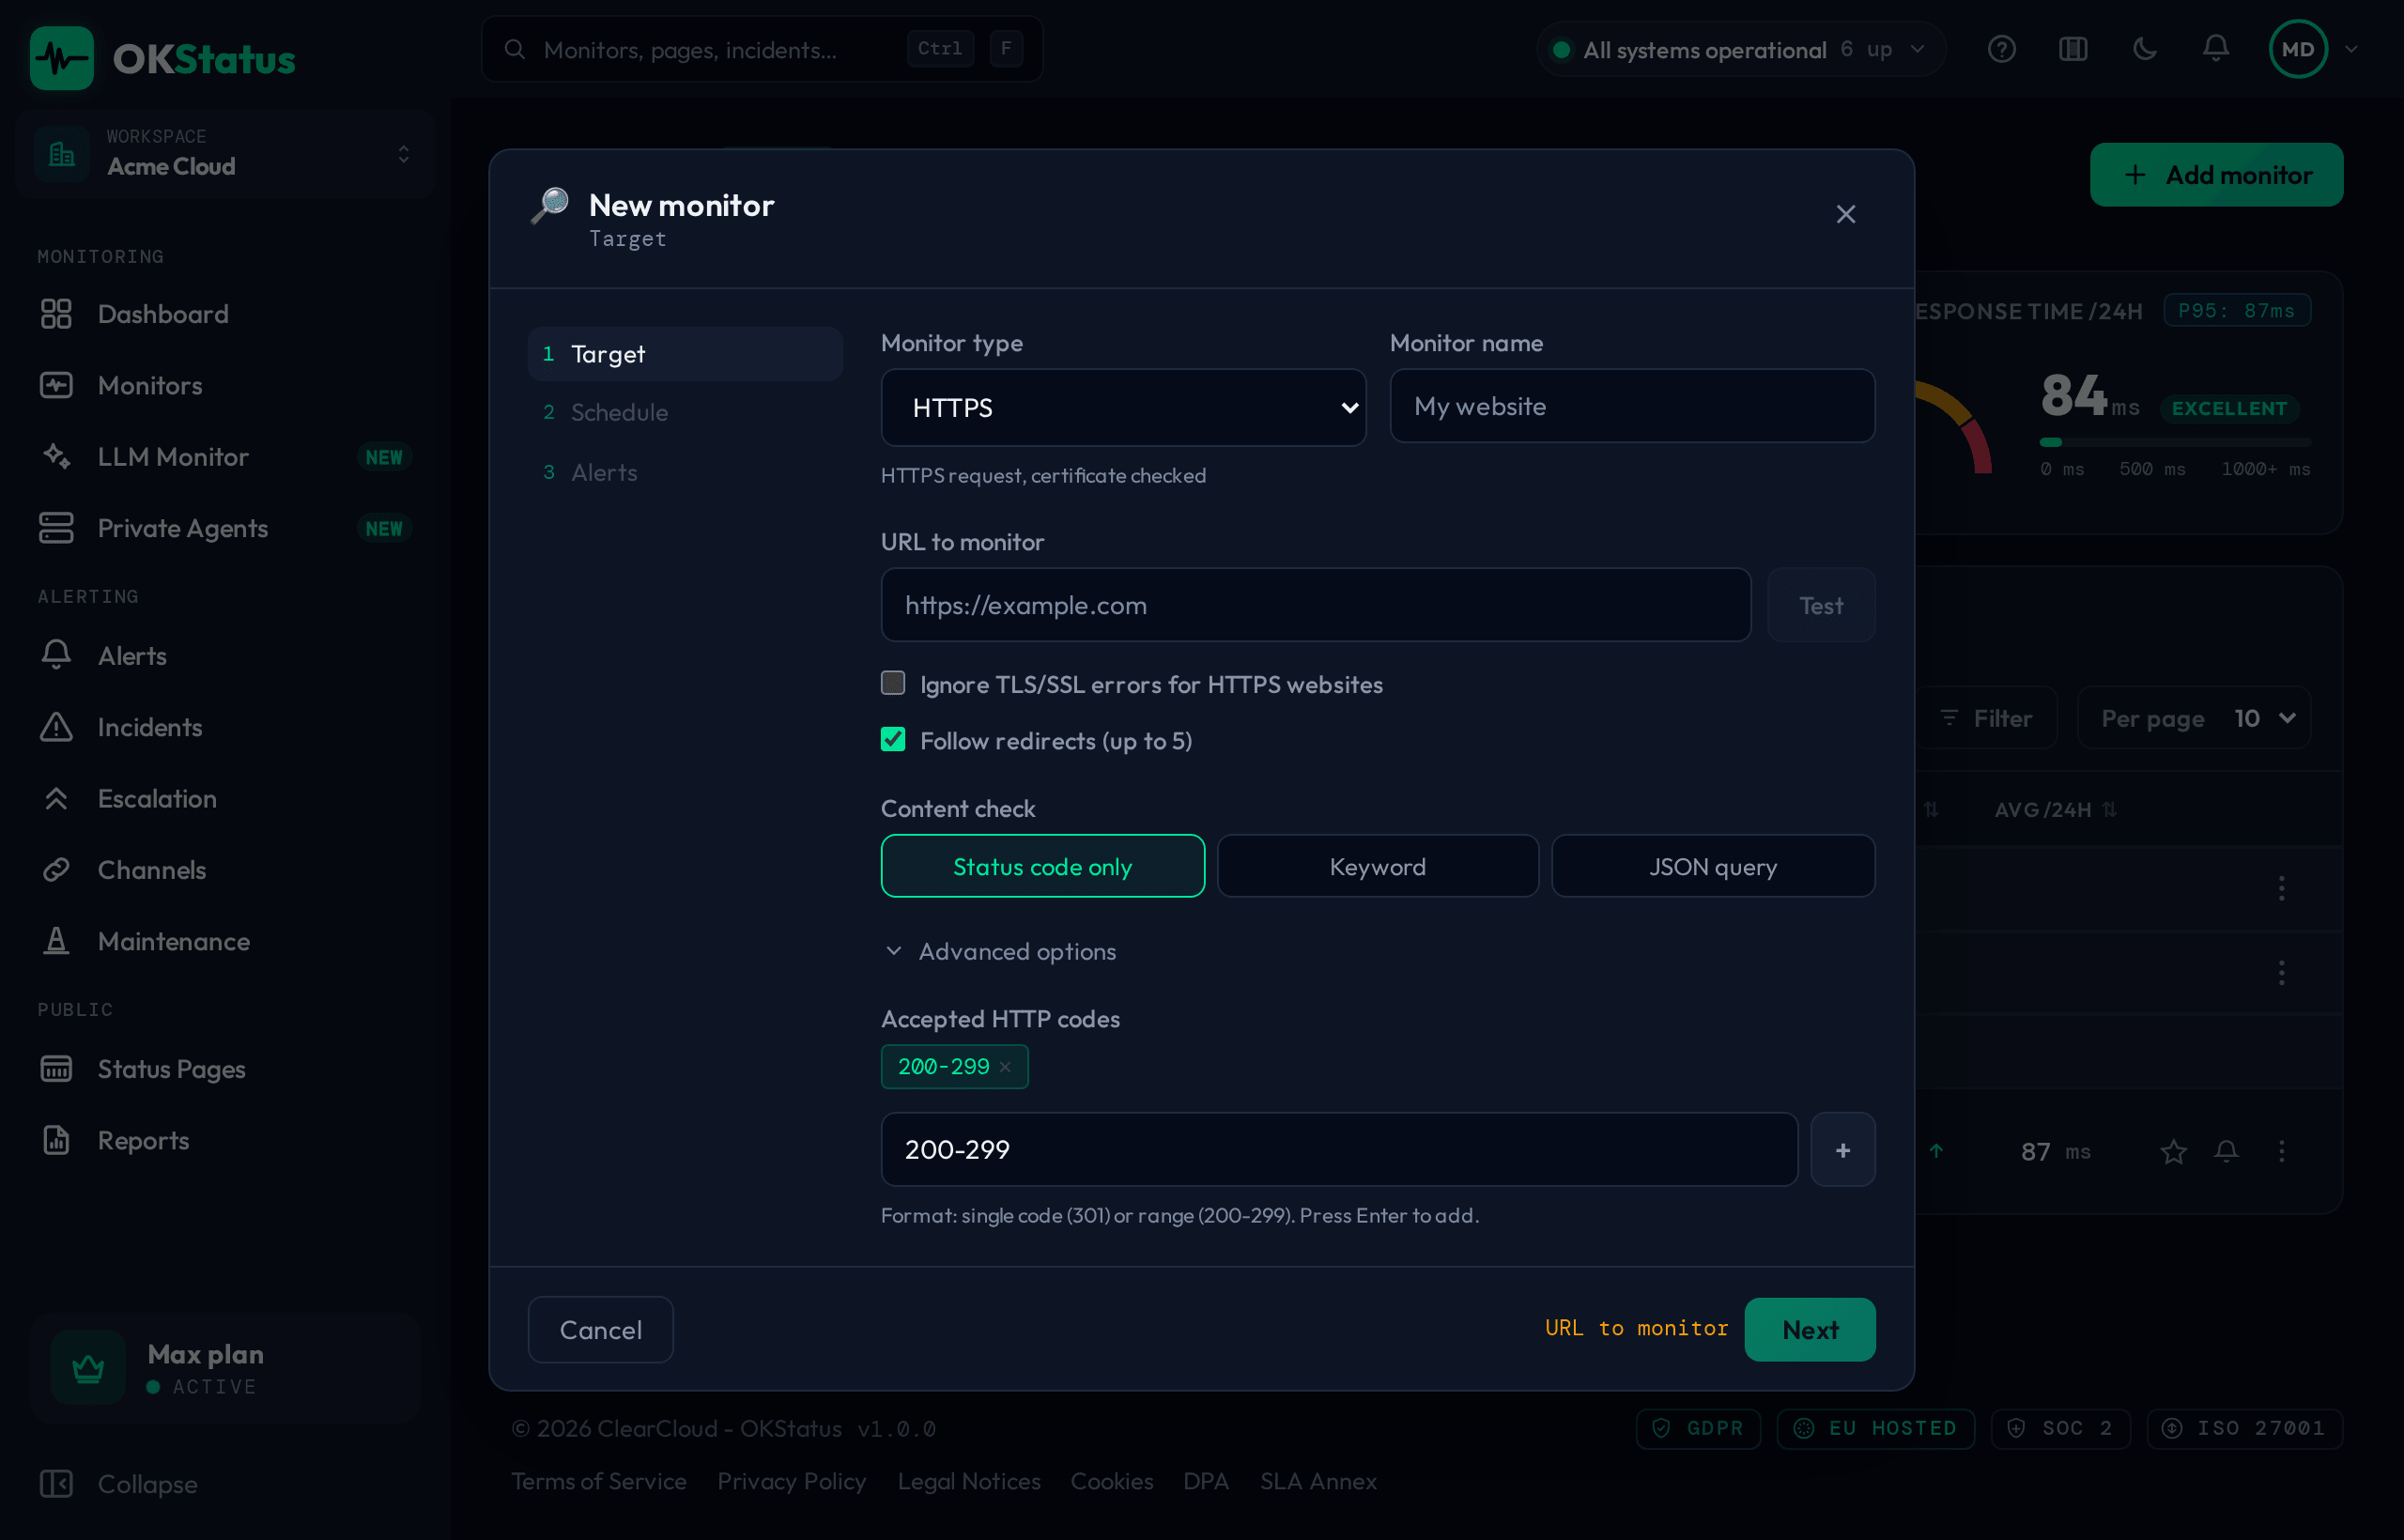
The HTTP/HTTPS monitor checks a web service’s availability by sending an HTTP request to the given URL and analyzing the response. It’s the most commonly used monitor type.
Basic settings
Section titled “Basic settings”| Setting | Description | Default |
|---|---|---|
| URL | Full service address (https://...) | — |
| Method | GET, POST, PUT, PATCH, DELETE, HEAD, OPTIONS | GET |
| Interval | Check frequency | shortest your plan allows |
| Expected code(s) | HTTP status code(s) treated as success, e.g. 200 or a range 200-299 | 200-299 |
| Regions | Check locations | one, the cheapest your plan has |
| Retries | Consecutive failures tolerated before the monitor is marked down | 1 (so 2 failures) |
Every check has a fixed 5-second budget — connect, response and, for HTTPS, the certificate read all happen inside it. There is no per-monitor timeout setting; a target that hasn’t answered within 5 s counts as a failed check.
Advanced settings
Section titled “Advanced settings”Authentication
Section titled “Authentication”A protected endpoint has its own block: Basic auth, Bearer token, API key (header or URL parameter), session cookie, OAuth2 client credentials, or a client certificate (mTLS). Every secret is encrypted at rest and masked on read — see Authentication.
Custom headers
Section titled “Custom headers”Add HTTP headers to every check request, on top of (or instead of) the authentication block:
X-Tenant: acmeContent-Type: application/jsonAccept: application/jsonRequest body
Section titled “Request body”For POST or PUT, define a JSON body sent with every check:
{ "health": true}Use case: verifying an API endpoint responds correctly to a POST request (e.g. a health-check endpoint expecting a specific body).
Content check: keyword or JSON query
Section titled “Content check: keyword or JSON query”On top of the status code, an HTTP monitor can validate the content of the response. In the monitor dialog (Target step, right under the URL) — the same dialog serves creation and editing — the Content check selector offers three modes:
| Mode | What it does |
|---|---|
| Status code only | Default — only the accepted status codes are checked. |
| Keyword | The check fails if the text isn’t found in the response body (or, inverted, if it is found). |
| JSON query | The response is parsed as JSON, a path is resolved and compared to an expected value. |
Keyword and JSON query are mutually exclusive: a monitor uses one or the other. The Test button evaluates the content check together with the status code, method, headers and credentials, so the result shown is exactly what the real checks will produce — a failed content check reports the reason (e.g. Keyword 'operational' not found in response body).
Keyword
Section titled “Keyword”| Field | Description |
|---|---|
| Keyword | Text searched in the raw response body — plain HTML or JSON. Case-sensitive. |
| Must be absent | Inverts the check: it fails when the keyword is found (maintenance page served with a 200). |
Example uses:
- Verify your homepage contains
Welcome(not an error page returned with a 200). - Verify an API returns
"status":"operational". - Detect maintenance pages served with a 200 status code.
JSON query
Section titled “JSON query”| Field | Description |
|---|---|
| JSON path | Dot notation from the root of the document: component.status, data.items.0.name. A leading $. is accepted. Use $ alone for the raw body. |
| Operator | ==, !=, contains, >, <, >=, <= |
| Expected value | Compared to the resolved value as strings (numbers and booleans are stringified: true, 42). Numeric operators parse both sides as numbers. |
The check fails when the body isn’t valid JSON, when the path doesn’t resolve, or when the comparison is false. $ skips the JSON parsing and compares the whole (trimmed) response body — handy for plain-text health endpoints that answer OK or pong.
Example — a Statuspage component endpoint such as https://public-cloud.status-ovhcloud.com/api/v2/components/8x32jhcpqq1m.json returns:
{ "page": { "...": "..." }, "component": { "name": "GRA1", "status": "operational" } }| JSON path | Operator | Expected value | Result |
|---|---|---|---|
component.status | == | operational | ✅ passes |
component.status | != | operational | ❌ fails as soon as the component is degraded/down |
$ | contains | "status":"operational" | ✅ passes (raw body) |
SSL / TLS certificate
Section titled “SSL / TLS certificate”For an https:// target, OKStatus reads the certificate on every check and
records the days left before expiry.
- An expired or otherwise invalid certificate makes the check fail.
- Expiry alerts fire on a Pro plan and above, at 30, 14, 7, 3 and 1 day before the certificate expires — one alert per threshold, not one per check. Domain-registration expiry is watched the same way, at 60, 30, 14 and 7 days.
- Both are their own alert kinds, so a channel can take outage alerts without the certificate ones (or the reverse).
Tick Ignore TLS/SSL errors for HTTPS websites on the monitor to accept a self-signed or expired certificate — for a staging environment you knowingly run that way.
Redirects
Section titled “Redirects”A monitor follows redirects by default, up to 5 hops, and each hop is re-checked against the same safety rules as the original URL. The status code that gets classified is the one at the end of the chain.
Turn Follow redirects off to check the URL exactly as you typed it. The monitor then also asks how to treat a 3xx that isn’t in your accepted codes:
| Setting for a 3xx | Result |
|---|---|
| Degraded (default) | The server answered — this is a configuration mismatch, not an outage. Amber, no page. |
| Down | Strict: any unexpected redirect is treated as an outage. |
4xx, 5xx and unreachable targets are always down once the retry window is
exhausted, whatever this setting says. If you want the redirect itself to count
as a success, add its code (e.g. 301) to the accepted status codes instead —
the Test button offers to do exactly that when it hits one.
Metrics collected
Section titled “Metrics collected”Every HTTP check records:
| Metric | Description |
|---|---|
| Status | up, degraded, or down |
| HTTP code | Response code (200, 404, 503…) |
| Latency | Total response time in ms |
| Region | Region the check ran from |
| Timestamp | Exact date and time of the check |
These metrics feed the dashboard charts, PDF reports, and the uptime calculations shown on your status pages.