Your monitors in your own Prometheus
One URL, one read-only key: Prometheus collects the status, per-region latency, availability and expiry dates of all your monitors. The Grafana dashboard and the alerting rules are ready to import.
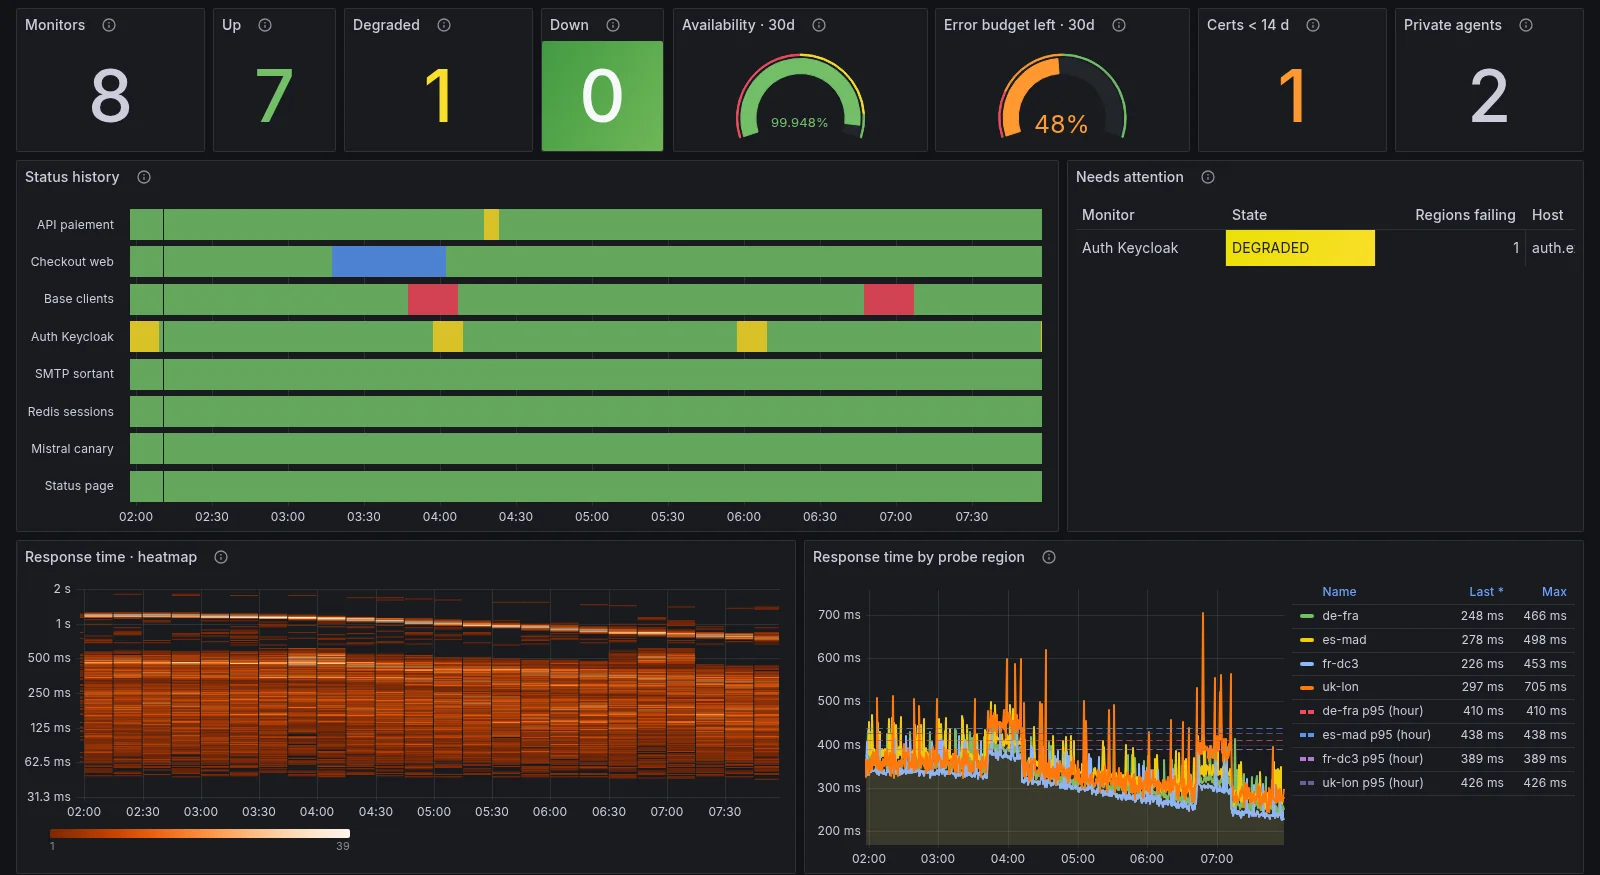
The figures of your OKStatus dashboard, in your stack
The same computations as the app: the majority rule for status, time-weighted availability for SLAs. No second truth in Grafana.
One key, one config block, one import
Nothing to install on your side: OKStatus already is the probe, Prometheus only reads.
Copy, paste, scraped
The key stays in a separate file. Labels carry the host only, never a monitor URL that could hold a token. Answers are cached 15 seconds and compressed, with a scrape budget separate from the rest of the API.
scrape_configs:
  - job_name: okstatus
    scrape_interval: 30s
    scheme: https
    metrics_path: /api/v1/metrics
    authorization:
      credentials_file: /etc/prometheus/okstatus.token
    static_configs:
- targets: [api.okstatus.eu]Nineteen panels, ready to import
Probe regions, availability against the SLA target, every monitor in one table, expirations, private agents. Filters by group, monitor, region and SLA window.
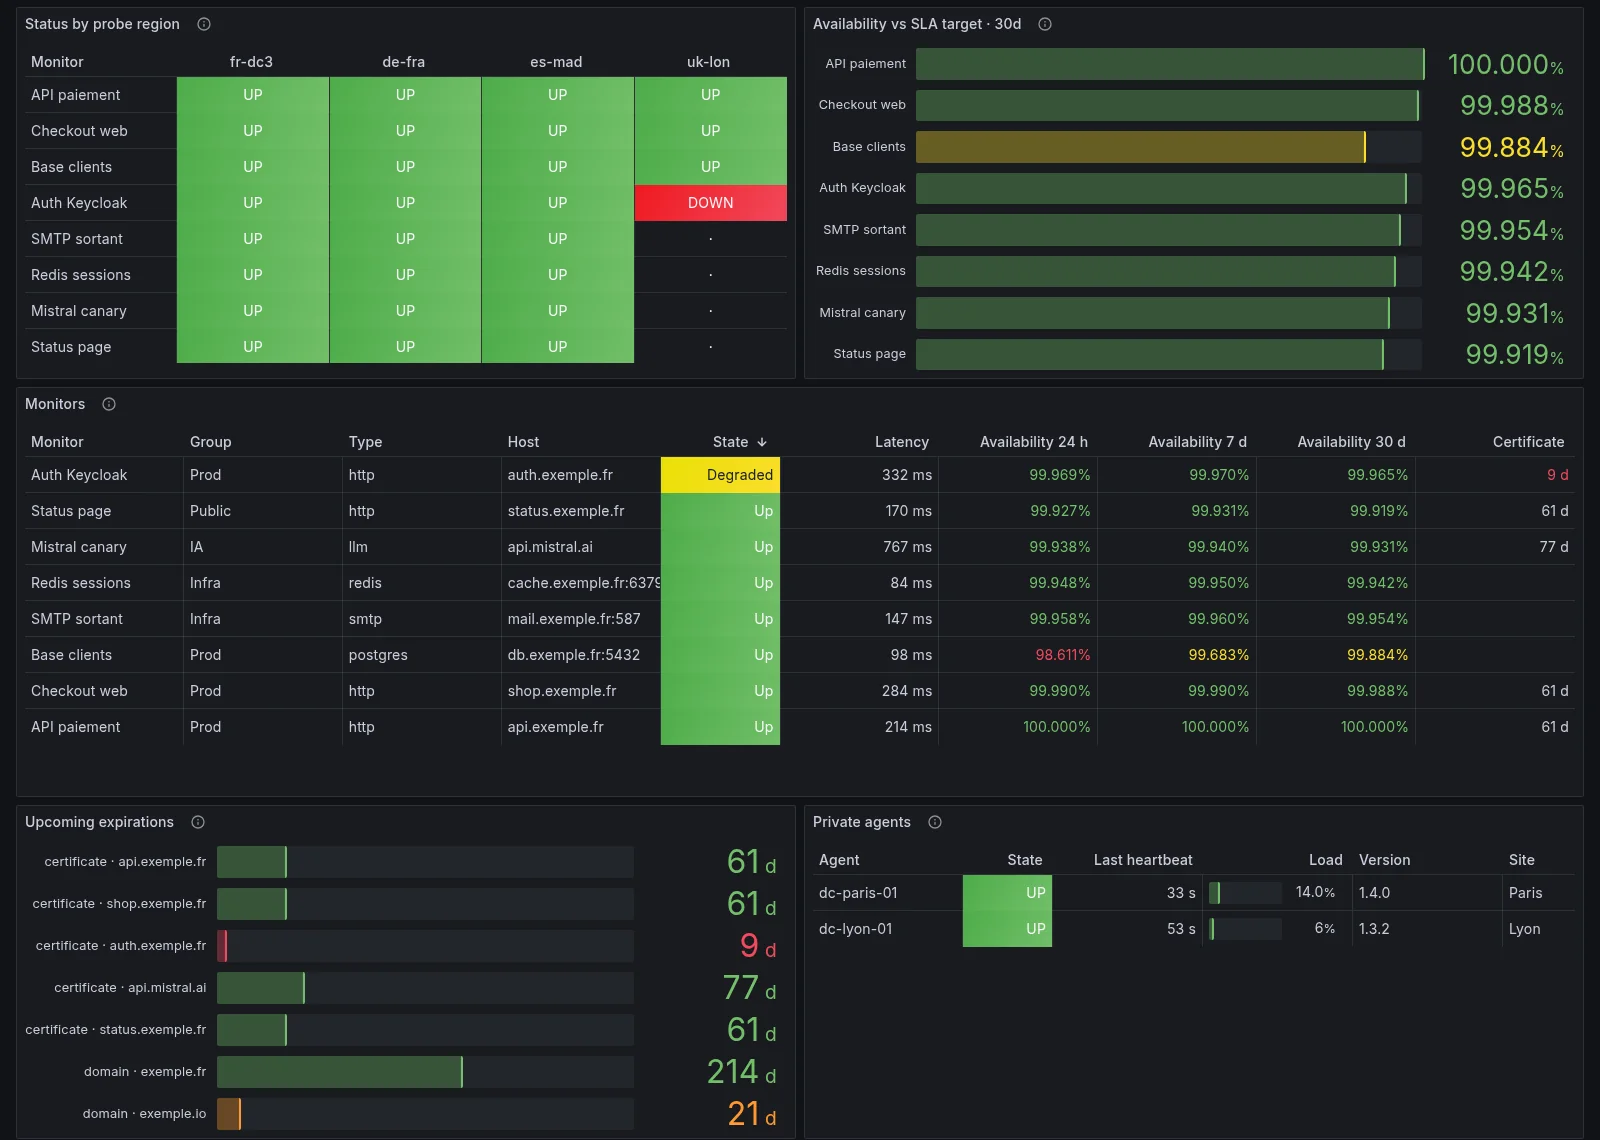 1Every monitor from every probe region2Availability against your SLA target3All your monitors, sortable4Certificates and domains about to expire
To see the outside view of your services next to your internal metrics, in your team's tools, and to correlate: a service down from outside and up from inside points to DNS, a CDN or routing, not the service itself. Alerts can stay with OKStatus, or go through your Alertmanager.
The figures of your monitors: names, hosts, states, response times. A Metrics key can't read anything else or change anything. Revoke it in Settings → API keys: it stops working at once.
Yes: anything that reads the Prometheus format. Grafana Alloy, the Grafana Cloud agent and vmagent scrape the URL like Prometheus does.
Every 30 or 60 seconds. The answer is computed at most every 15 seconds: scraping faster doesn't give fresher figures.
Your first monitor in under a minute.
Free plan, no card. Hosted and operated in Europe.