Everything on one screen.
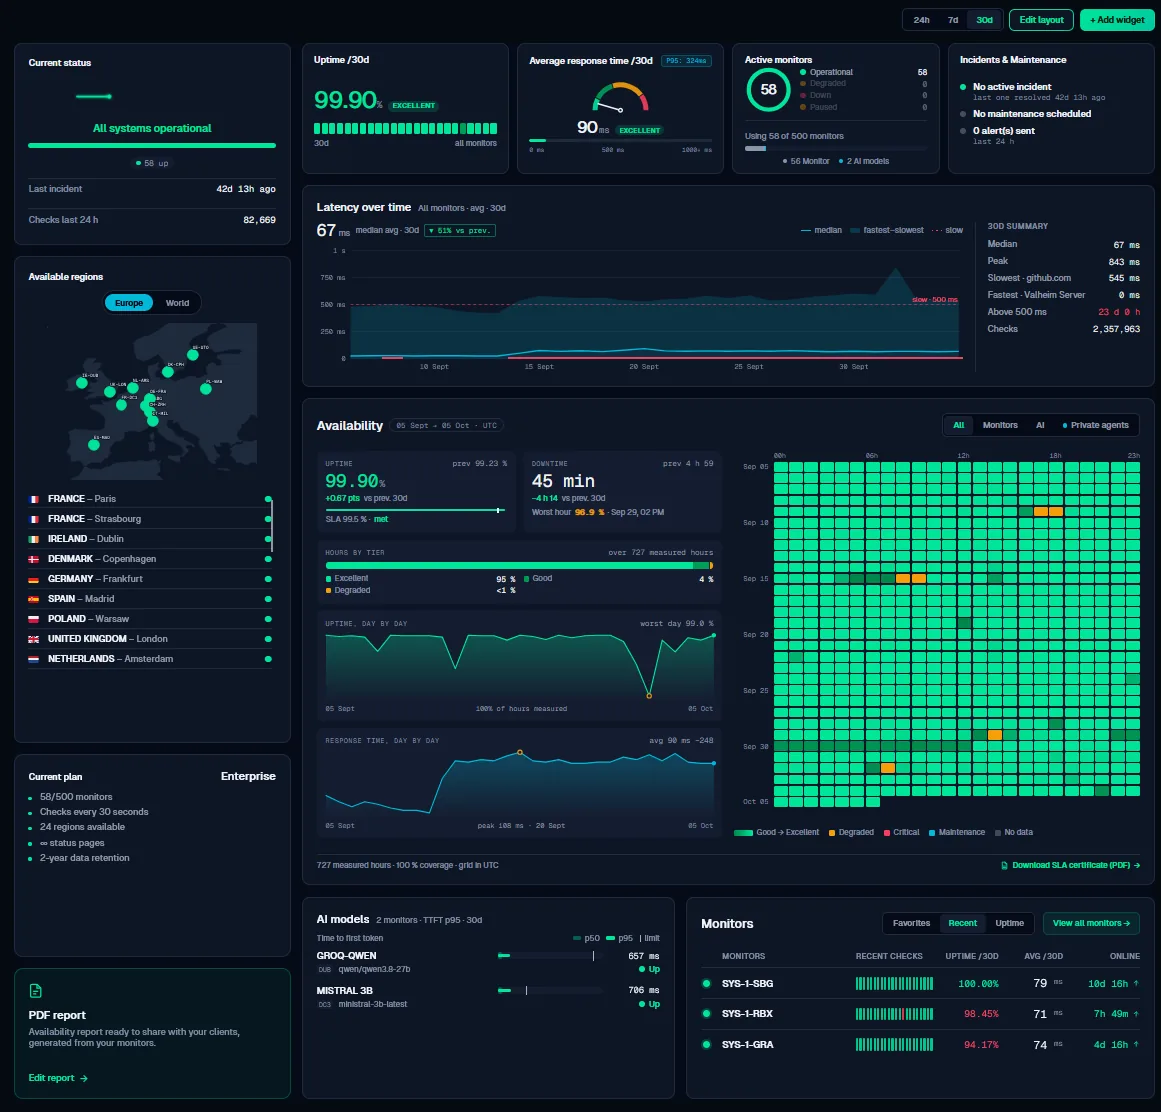
Global uptime, response time, active monitors, ongoing incidents and maintenance: the essentials visible the moment you sign in, no digging through submenus.
All plansThe same dashboard on every plan
A tour
Built to be read in 5 seconds.
One screen answers the three questions of a morning check: is everything up, is anything slow, is anything scheduled.
1Status at a glance2Uptime, latency, monitors3Regions for your plan4Hour-by-hour availability5AI models and monitorsWhat you see
No digging, no submenus.
The same view on every plan.
Immediate overview
Uptime, latency, active monitors and ongoing incidents, without navigating between pages.Regions at a glance
The map of the regions your plan includes, without going back through settings.Incidents & maintenance together
What's active and what's scheduled, on the same view.Availability heatmap
Every hour of the period, with a link to the PDF SLA report.Editable layout
Rearrange and add widgets, and switch between 24 h, 7 d and 30 d.Your plan, live
Monitors used, interval, regions and retention, always visible.Yes. What changes with the plan is the number of monitors, the regions and how much history is kept.
Your first monitor in under a minute.
Free plan, no card. Hosted and operated in Europe.